MYSQL is using high cpu

Hi there!

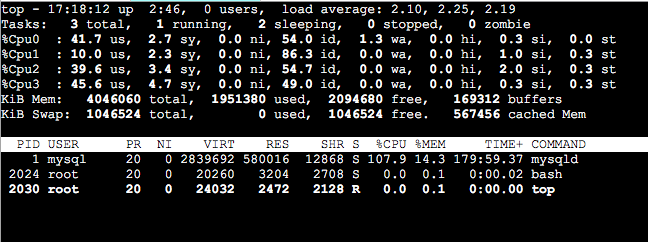
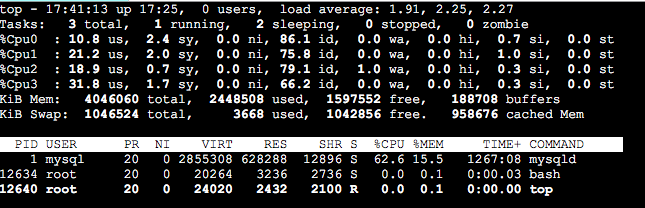
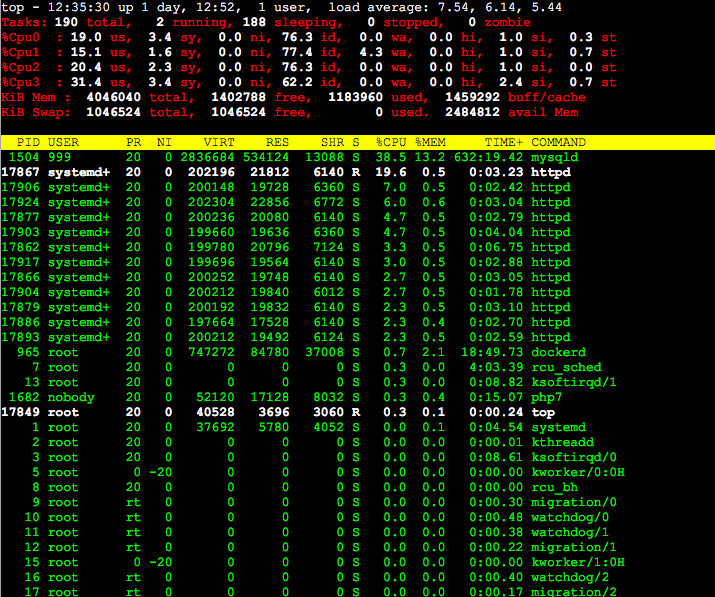
We are running XIBO in docker version 1.8.5 and I can observe the high cpu utilization and high load average from mysql process.

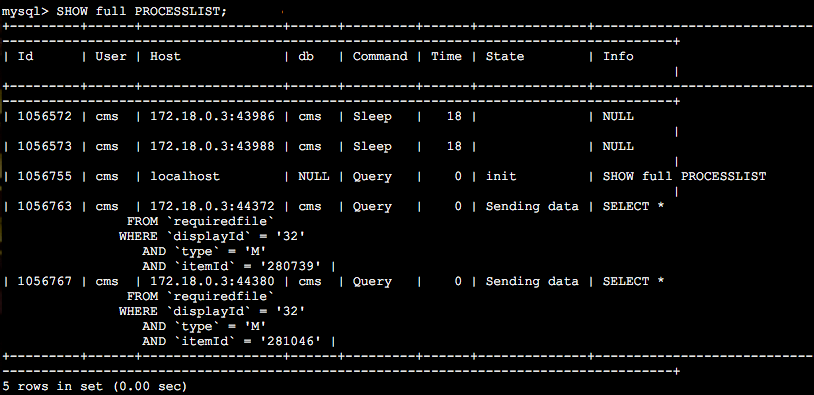
show full processlist for example returns below:

| 1274123 | cms | 172.18.0.3:39030 | cms | Query | 1 | Sending data | SELECT stat.*, display.Display, layout.Layout, media.Name AS MediaName
FROM stat
INNER JOIN display
ON stat.DisplayID = display.DisplayID
LEFT OUTER JOIN layout
ON layout.LayoutID = stat.LayoutID
LEFT OUTER JOIN media
ON media.mediaID = stat.mediaID
WHERE 1 = 1
AND stat.statDate >= '2018-02-27 00:00:00’
AND stat.statDate < '2018-03-06 00:00:00’
ORDER BY stat.statDate
LIMIT 341000, 1000 |

mysql> select count() from media;
±---------+
| count(
) |
±---------+
| 1393 |
±---------+
1 row in set (0.00 sec)

top - 22:45:41 up 1 day, 1:42, 0 users, load average: 3.39, 2.91, 2.39
Tasks: 3 total, 1 running, 2 sleeping, 0 stopped, 0 zombie
%Cpu0 : 62.8 us, 5.5 sy, 0.0 ni, 29.1 id, 0.0 wa, 0.0 hi, 2.5 si, 0.0 st
%Cpu1 : 56.6 us, 4.1 sy, 0.0 ni, 38.3 id, 0.0 wa, 0.0 hi, 1.0 si, 0.0 st
%Cpu2 : 53.5 us, 2.5 sy, 0.0 ni, 28.8 id, 12.1 wa, 0.0 hi, 2.5 si, 0.5 st
%Cpu3 : 90.4 us, 1.0 sy, 0.0 ni, 8.6 id, 0.0 wa, 0.0 hi, 0.0 si, 0.0 st
KiB Mem: 4046060 total, 2768900 used, 1277160 free, 189744 buffers
KiB Swap: 1046524 total, 23160 used, 1023364 free. 1113724 cached Mem

PID USER PR NI VIRT RES SHR S %CPU %MEM TIME+ COMMAND
1 mysql 20 0 2840344 631584 13092 S 244.3 15.6 1189:15 mysqld
14408 root 20 0 20264 3256 2756 S 0.0 0.1 0:00.03 bash
14424 root 20 0 24020 2516 2180 R 0.0 0.1 0:00.00 top

Thanks.

Looks like either someone is exporting statistics from the CMS UI, or the stats archive task is running.

This will cause high CPU usage as it’s an expensive process to archive off or export statistics records, as there are often tens of thousands or more of them.

Assuming it is the stats archive task, you might consider turning stats off if you don’t use them (they’re hugely expensive to collect and process), or reconfiguring the archive task to do smaller periods. It defaults to one week, but one day might be more appropriate.

Hi Alex,

I did it, but the high cpu usage continue. Is there other changes that I can do?
image

You did what? I presented several options, so without knowing what you changed I can’t give you further guidance.

If you changed the task config, but it’s running already, then you’ll have to allow it to finish before those changes will apply.

If you turned stats off, then again, you’ll have to allow all the stats to be purged from the database by the archive tool before anything will change. You could manually truncate the stat table, but you’ll loose any statistics you currently have stored. To do that, kill the running MySQL query (you can get the ID from the process list), and then run truncate stat; and optimize table stat; to free the storage associated with that table.

Alex,

I did the schedule changes regarding the stats config. The task is stopped.

By the way I did the truncate stat table and log as well. After that I did optimize table and restart mysql server. Let’s see what is the next.

Thank you very much.

If you’re not using stats, then turn them off too as it’ll remove a huge amount of work for the Players and the CMS.

the stats already turned off. by the way I continue seeing high utilization…and I have just 40 players connected.

image

What is the query that is running? Is the stats archive task showing as running?

for example, this one below

If you go in to the CMS Displays page, and find display ID 32, and then Manage, does it show a very large number of files in the list of media items to download?

Right now nothing pending to download from ID 32.

Not pending to download, but just the total number of media items

around 1100 items !!! :grinning:

image

And I presume you’ve not deliberately assigned that many media items to the display in your layouts?

You could try applying this patch:

It’s against 1.8.7 and we don’t think that this should have affected 1.8.5 - which is I believe what you’re running.

To apply the patch, connect to your CMS container (the container name may differ on your system)

docker exec -ti xibodocker_cms-web_1 bash

Once inside the container, run

cd /var/www/cms
curl -SL https://github.com/dasgarner/xibo-cms/commit/192407fbd0767e1d48dd0bf664f6c9e71ebc8711.diff | patch -p1
exit

You’ll then need to wait for a while for that to take effect - perhaps a few hours.

Alex,

I followed the guide to apply the patch. Let’s see after some hours, I will let you know.

Many Thanks.

Thiago

OK sure. You should see the number of media items steadily drop in the media table as the cache period expires on each of your widgets.

Ok, I will check this one asap.

Thanks again.

Hello Alex,

I have configured a routine to clear the log table every hour and I can see that this is OK. But I am facing yet high load average. Is there other thing that we can do?

Thanks.

I think that apache is using high cpu as well, see the print.

That all looks normal to me. You will have lots of apache processes, and the more you have, the harder MySQL will work.

If the server you have isn’t keeping up with the load, you can either get a better server, or reduce the number of requests you’re asking it to handle by changing the options inside Xibo (for example turning off stats, lowering log levels etc)