Xibo CMS 1.8.2 - Docker Type (Upgraded from 1.7.x Non-Docker Install)
Hyper-V VM Running Ubuntu 16.04.03 LTS
3GB RAM (Usually at 25-50% usage)
Our Xibo install’s maintenance process seems to be having some trouble. Talking with Peter, we realized the issue as part of debugging the fact that our Xibo web ui would take forever to become available when we rebooted the VM. It seems that when the VM reboots it prompts to run maintenance, at this point mysqld takes up most of the CPU, RAM is fine. It sits like this with mysqld, presumably engaged in the maintenance process. Eating up the CPU for around 12m. Then it starts to taper off and the web ui becomes available and everything seems, on the surface, to be fine.
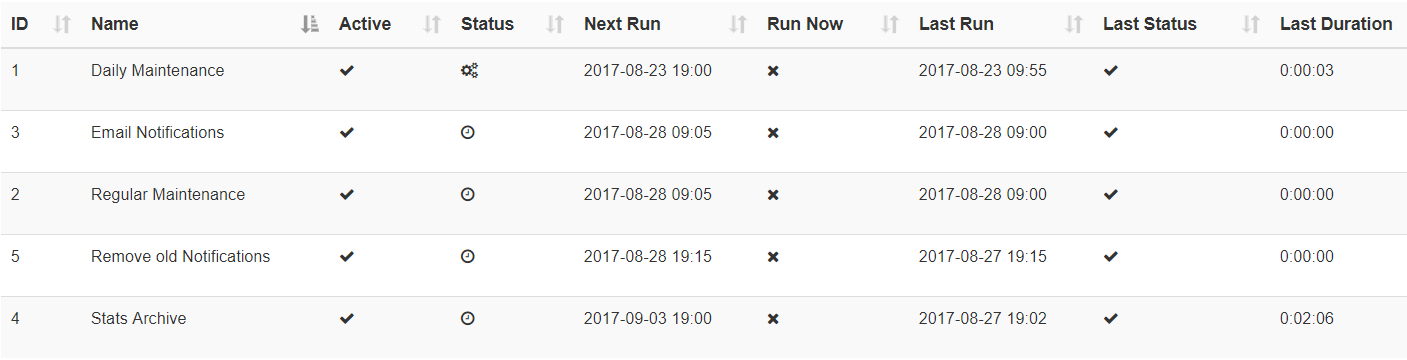
That said, when we go to the Tasks section of Administration, Daily Maintenance has a gear icon instead of the clock like the rest, Last Run appears to be the time of the reboot, and Next run is a time set after the last run but nonetheless, in the past as of now. If I try to use Run Now, nothing seems to happen or change. The other maintenance processes appear from their entries to be working fine with the exception of Stats Archive which I turned on and which now consistently shows a gear, has no last run, always has a next run of the current time, and doesn’t seem to respond to Run Now.
Maintenance taking a long time to run is typically because you have alot of log or stats entries that the system is trying to purge, and isn’t able to do that before the system times the process out.
Please connect to your database, and run the following SQL queries:
SELECT count(*) from stat;
SELECT count(*) from log;
SELECT min(start) from stat;
SELECT min(statDate) from stat;
What do those output?
If you’re not sure how to run those, please see this:
Sorry for the delay. Running that set of commands I got:
Stat Count: 165545
Log Count: 245427
Start: 2017-08-06 00:20:42
StatDate: 2017-08-08 00:01:44
Also, just as a note, I was trying to do an administrative “Tidy Library” and it said “Unexpected Error, Please Contact Support”. So potentially after we fix the maintenance problem, might look at that or it may be the same issue, we’ll see.
There’s a bug already logged for the Tidy Library issue.
I don’t think that’s related to your maintenance run time.
The numbers you have in stat don’t look unreasonable. The number in log does though. I’d expect almost no logs to be generated on a healthy CMS. Have you got debugging or auditing turned on somewhere?
Ok, good to know on the Tidy issue. As far as auditing and debugging, I don’t think so. I’ve been through most if not all the settings and what logging was turned on was set to the Error level. That said when I look at my logs I have a lot of entries that look like this.
464733 c3a7ef8 2017-08-12 15:40 CONSOLE GET ALERT / Layout has empty region
I might submit that it seems like a small bit of a bug to require a region be filled purely in the sense that if I make a placeholder layout to remind me of something I want to do later. There is no way of knowing that is going to create these kind of log issues, the front end even seems to handle the situation fairly elegantly by giving the layout a gear icon and saying that it hasn’t been built yet. If an empty region is going to be this kind of issue the CMS should fight its existence a bit more vehemently would think.
Ok, so after going through and cleaning things up. We did a couple reboots and for the last one, we had a Daily Maintenance run time of 4s.
The Log query is now still high-ish but decidedly lower at 173024, with that hopefully decreasing over time as old entries continue to fall off the back.
My only remaining concern in this vein, and it may just be house cleaning, is that while the Daily Maintenance is listing as completed in 4s. The Status column still shows a gear set instead of a clock, and when I hover over the gear it says “PID: 0 (1969-12-31 18:00)”. I’ll also be keeping an eye on it to see if the next and last run columns update appropriately tonight.
As of this morning;
Daily Maintenance still has the gears icon, its Last Run and its Next Run are both dated the 18th, which was the day of the last reboot.
All other Maintenance lines seem to be working as would be expected.
Ok, I truncated the log table and rebooted the instance, my readout is now…
Daily Maintenance
Active: Check
Status: Gears
Next Run:2017-08-23 19:00
Run Now: X
Last Run: 2017-08-23 09:41
Last Status: Check
Last Duration: 0:00:02
I refreshed a couple times over the course of a few minutes to see if the gears would go away, but so far they remain.
We may be on the path to the solution here. In the CMS I went to Administration -> Settings, and search all the tabs. I found the XMR Public Address tab but not the XMR Address.
Our XMR Public Address is technically tcp://:9505, It’s only used on the internal network and systems ping against the server name fine so I assume this is ok, but it might be worth noting.