I have a table of 6 column and 1000 rows, I need to visualize it into bar chart.
following the tutorial here; Chart Module Guide - Xibo CMS 1.8.10.
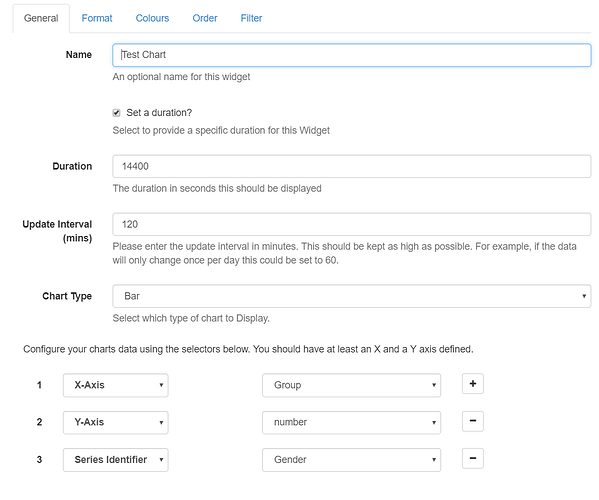
Here’s my configuration:
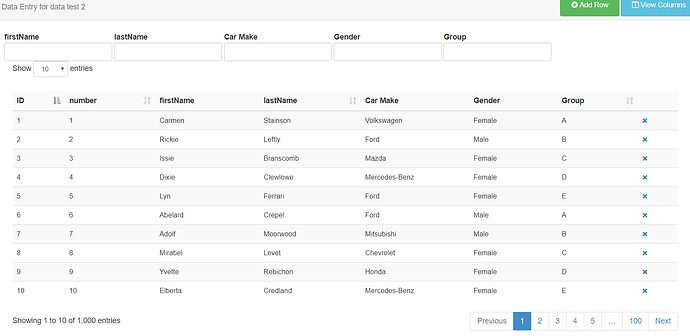
here’s my sample data:
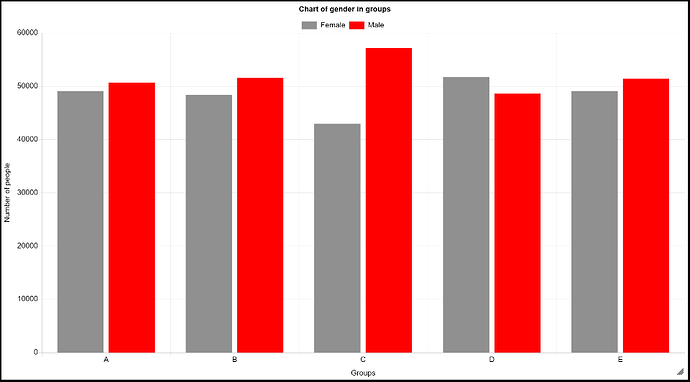
based on the chart generated:
it seems that the dataset is taking the rows ‘id’ as value.
Can Xibo dataset count each rows as 1?
Please help,
Thanks in advance.


