Hi all
Wonder if anyone can point me in the right direction with columns for Xibo. Im struggling to get a bar chart to show the way I want it to in the chart module and I think its my column declarations that are the problem.
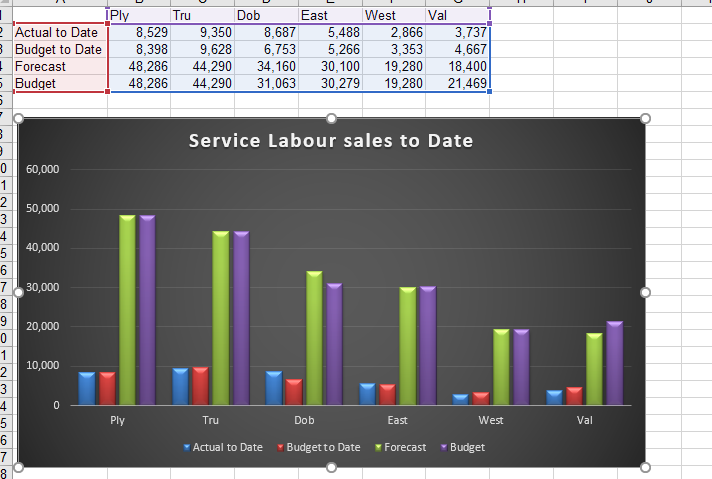
I have the data incoming from a Json file fine and Ive set up the columns so the dataset is laid out exactly as the Excel spreadsheet but I cant work out how to manipulate my dataset correctly… Heres the excel data with the chart Im trying to replicate :
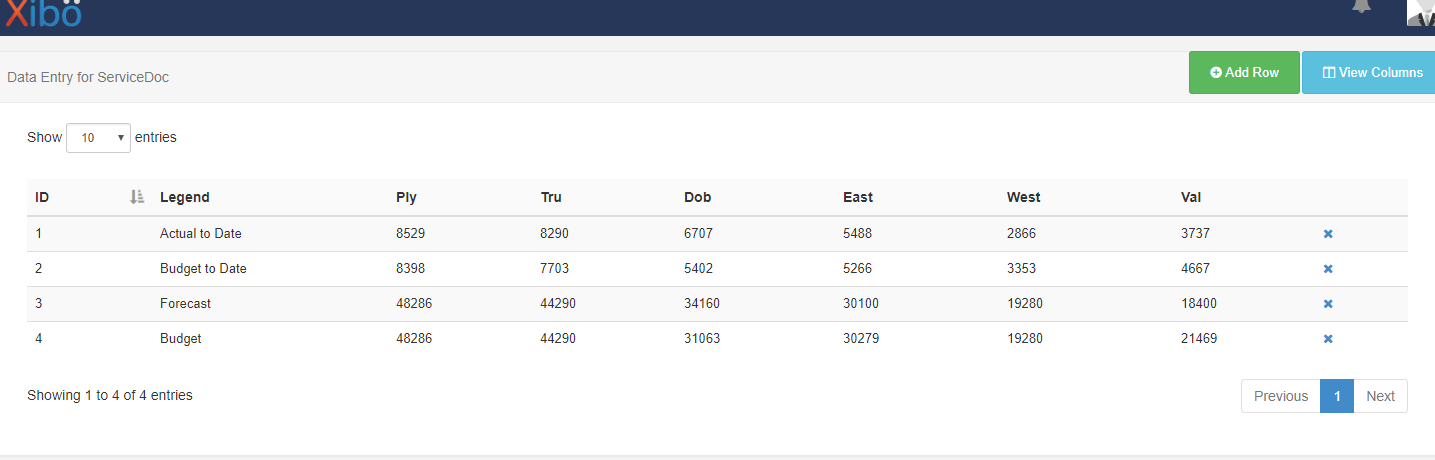
This is my dataset :
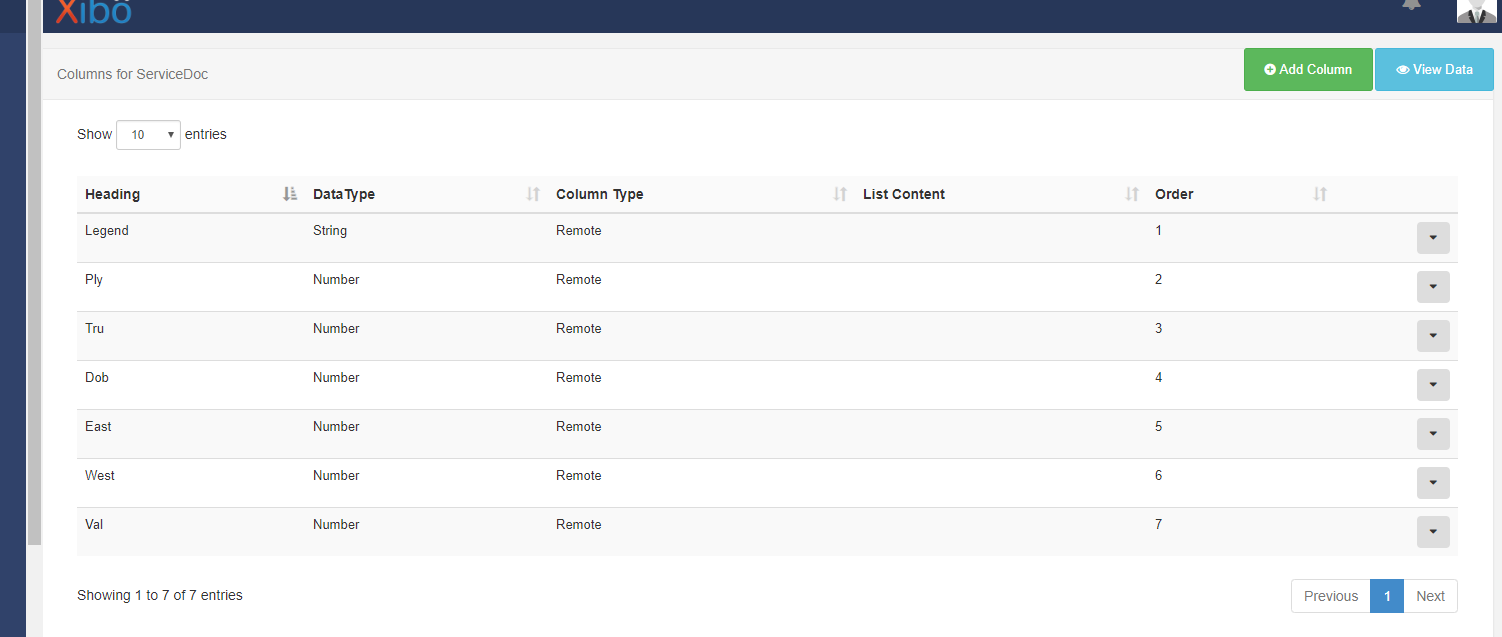
and my columns :
If someone might be able to point me in the right direction for what should be x axis, y axis etc Id really appreciate it…
Thanks
Jimbo
