I may have a unique situation here but hoping you all can help.
We have classrooms in our school that are currently displayed on digital signage using software called PADS. Currently running on XP so I need to get shut of it.
Students look on the screens to see what classroom their lesson is in.
I know you can use a dataset for say 1 meeting room’s timetable, but is there a way to link say an excel spreadsheet or Google sheet to a Xibo layout to show all results for the current period on the current day?
The troublesome bit is that 1 staff member plans the week ahead on an excel sheet. 1 sheet with columns called “Day, Period, Year Group, Subject, Teacher & Room”.
What we would like is for Xibo to only display the current lesson for the current day, but for all year groups/classrooms.
They don’t need the first two actually displayed on screen.
I’m needing something easy for a staff member to maintain a week in advance.
Not really, no - you can import a CSV file and if you have a predefined structure that is a simple, but manual, operation.
Alternatively you could switch from using Excel to using Xibo directly and manage it all in your DataSet.
Assuming you’re able to get the data into Xibo in a sensible fashion, I don’t see any problems displaying it as you have asked - its just a Layout with a DataSetView Widget on it, filtered by Day and period. You’d have a Layout per period with the appropriate filters set.
Thanks for your reply.
I have been working on this yesterday and managed to get a good layout, with the data imported from CSV into a dataset. I can manually filter the ticker to say filter where day is equal to Monday and Period is equal to 1, but I’ve realised in this way, I would have to create a layout, per period, per day…
Is there an advanced SQL string that I could give it to say filter "where day = TODAY and period = 1"
In the sense that TODAY could just be Monday, Tuesday etc?
Then I would only need 5 layouts, 1 per period and it would automatically filter on Monday/Tuesday etc. Does that make sense?
Hope you can help. I know there is a SQL command for the date, but is there a SQL command for day?
Thank you for your reply Dan, this helped me out!
I was struggling for a while before I realised I hadn’t told it to filter on the column I have called Day. I just had the filter set as “DAYNAME(NOW()) AND Period=‘1’” and I was pulling my hair out.
Quick change to “Day=DAYNAME(NOW()) AND Period=‘1’” and this works perfect.
Final question: I now have it down to 5 layouts on a schedule. 1 per period, however this means that the staff member adding content to the main slideshow of images/messages would need to add this content on to 5 different layouts. Is there a way to make either: 1 timeline of images, appear across multiple layouts? or make the Ticker widget change at a set time of day (then I can consolidate down to a single layout, with 1 timeline of images and a region with 5 tickers set to change over at a certain time.
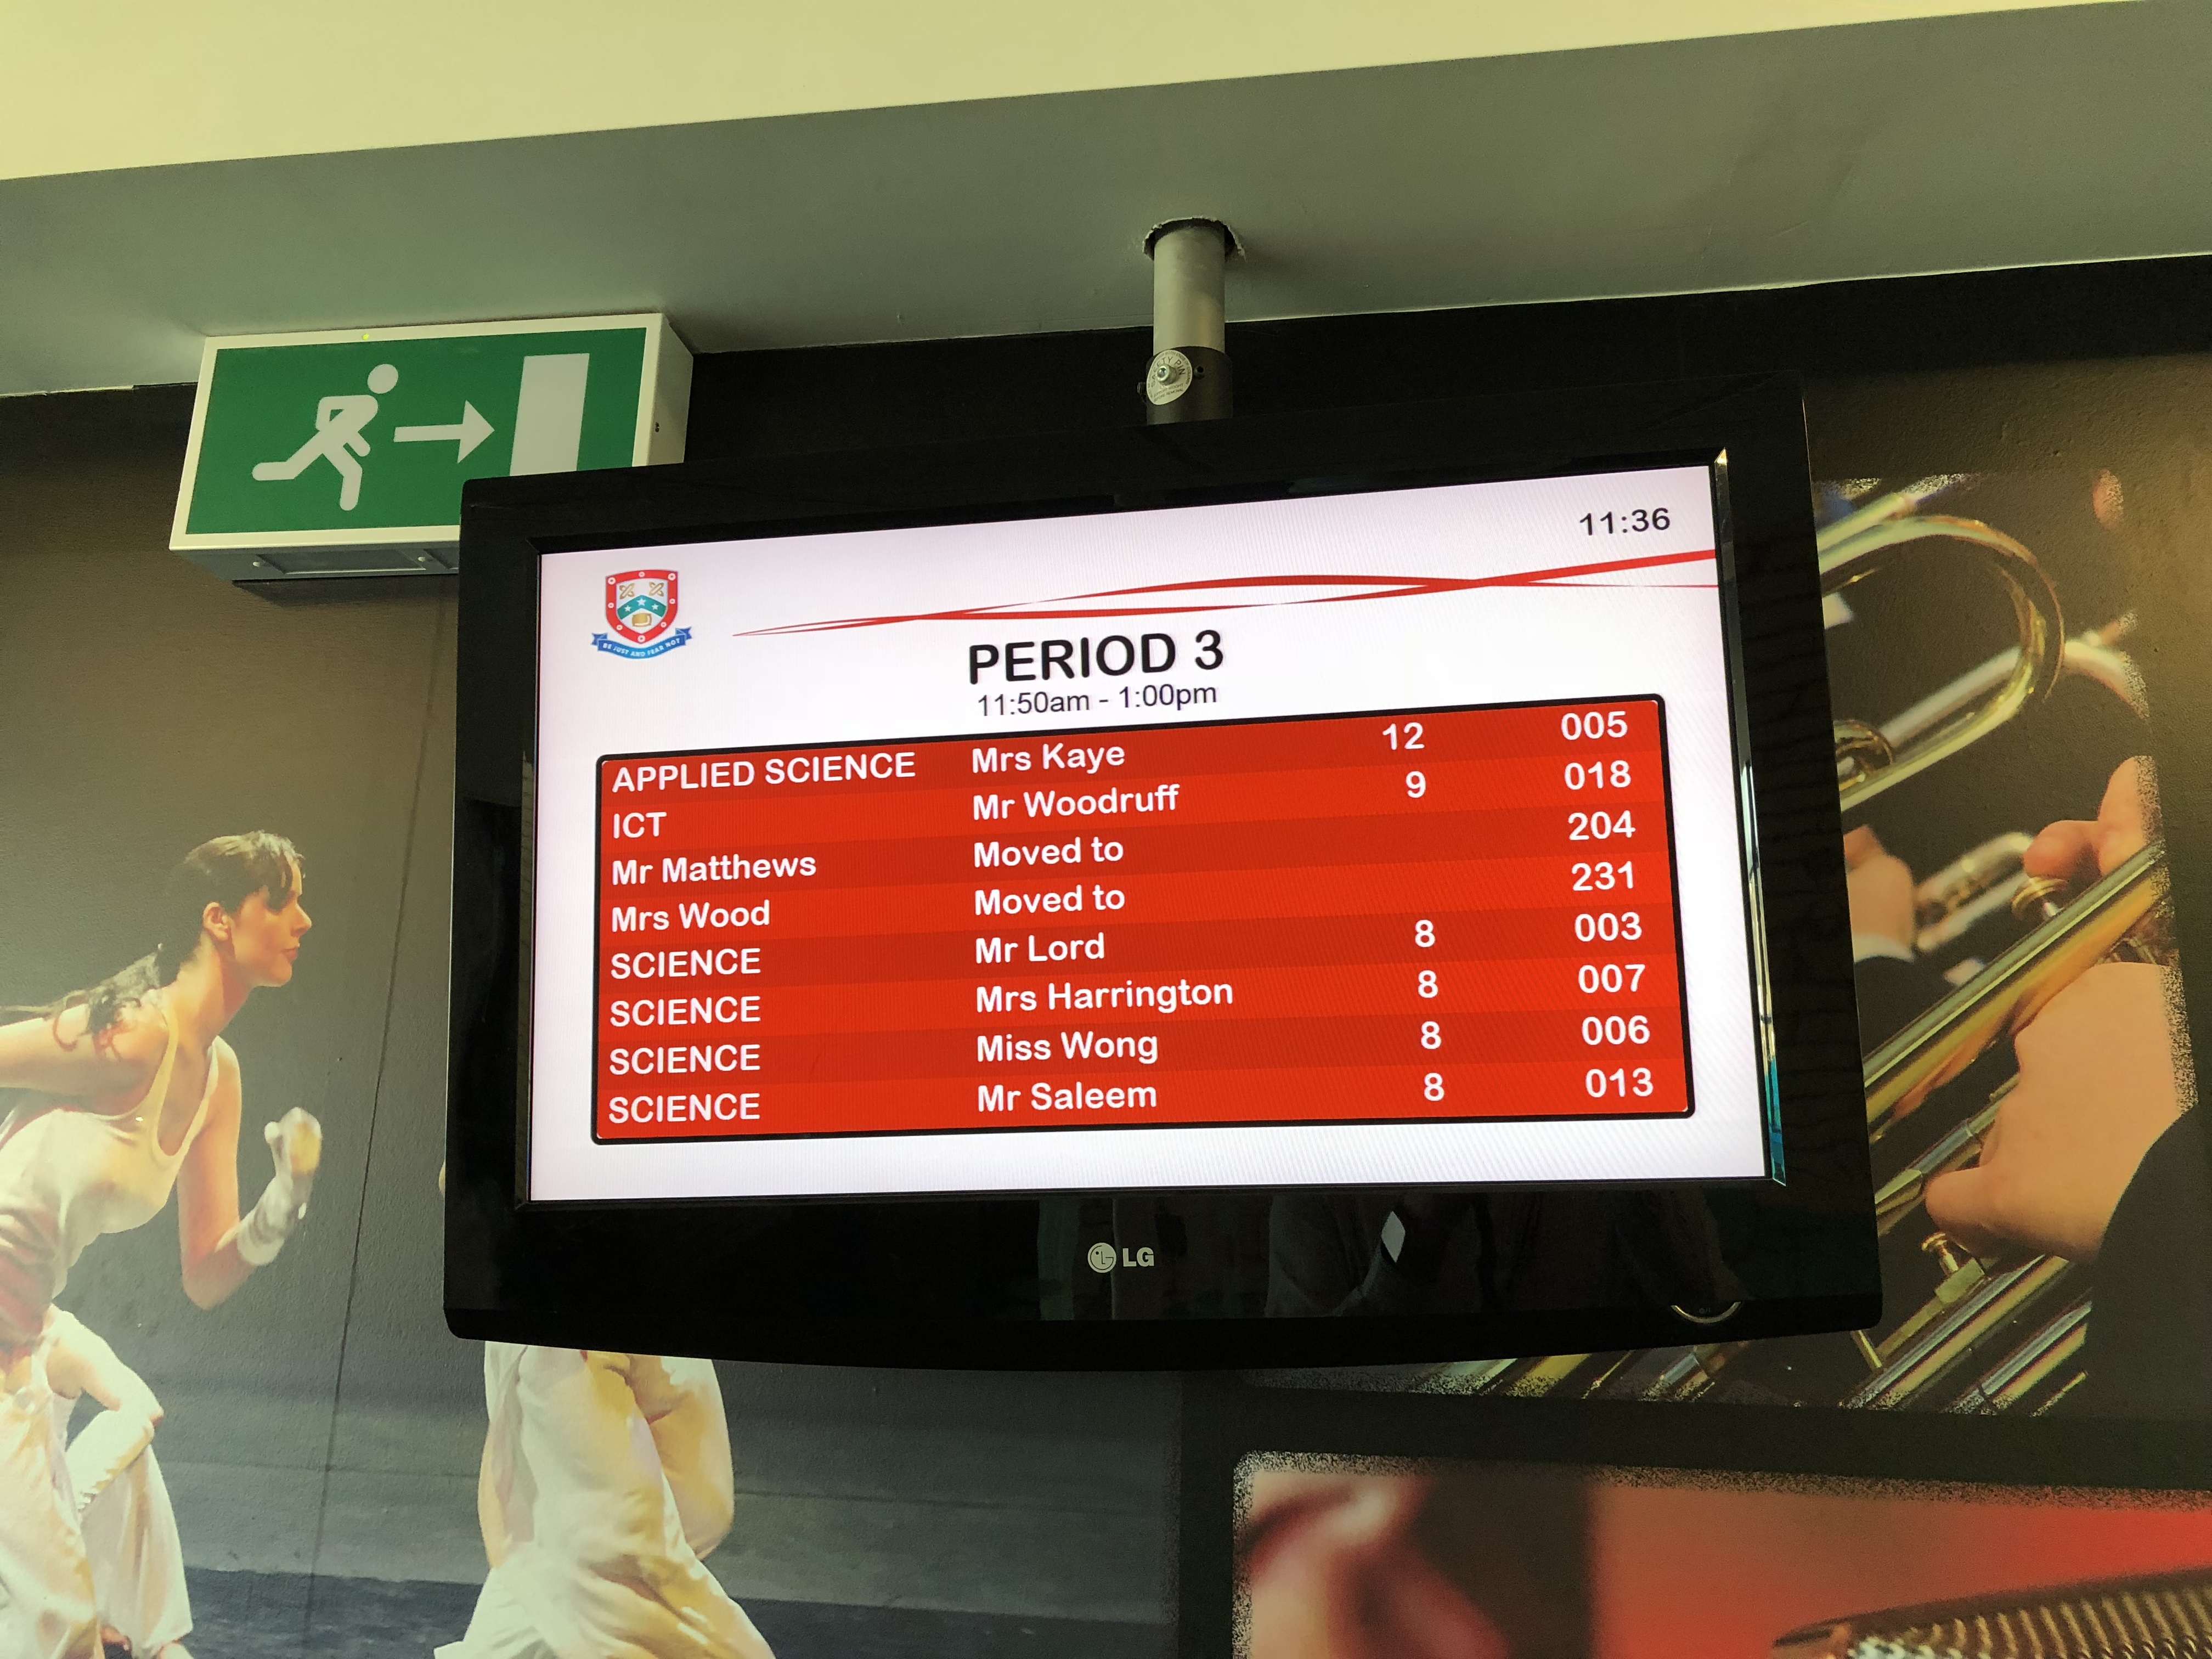
Here is an image of what we now have and it’s looking great.
I can’t find a CSS sheet but I have copied and pasted the source code for the region.
It is a Ticker from a DataSet. The DataSet is our weekly classroom timetable which is just uploaded from a CSV file every Friday by a staff member responsible for roomings.
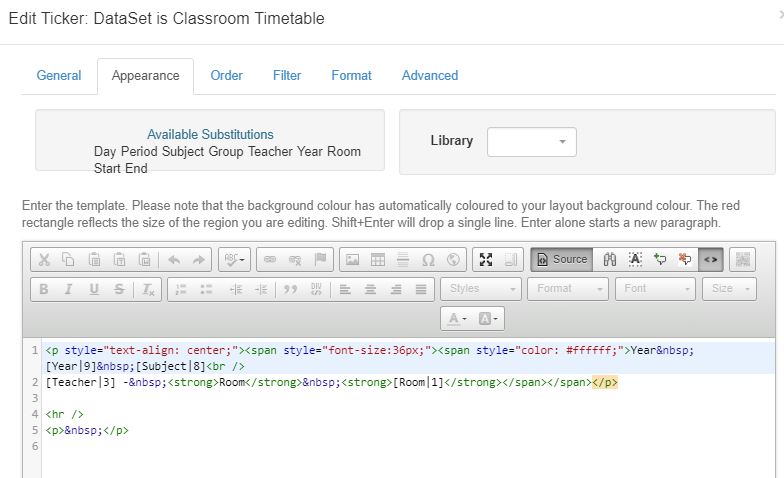
The source code from the “appearance” settings of the ticker widget are in the attached image (it wouldn’t let me paste it in here as it doesn’t show the code, just the outcome).
This should then look like the below when pasted in your “appearance” settings but obviously check your column headings on your DataSet.
Year [Year|9] [Subject|8]
[Teacher|3] - Room[Room|1]