my issue is: I am having a lot of “Internal error server” on my xibo 1.8.5 with 23 displays with Android players. (Especially within the regions).
I have another instance of Xibo (1.7.9) on the same server (Hostgator VPS / centOS 6.9 / 2 processors / 4 GB RAM a lot of disk space).
the version 1.7.9 is working fine, with same Android Players and 19 displays. The layouts loads very fast, but the other instance of Xibo (1.8.5) is very slow loading any layout (regions) and very frecuently i have this “Internal server error”.
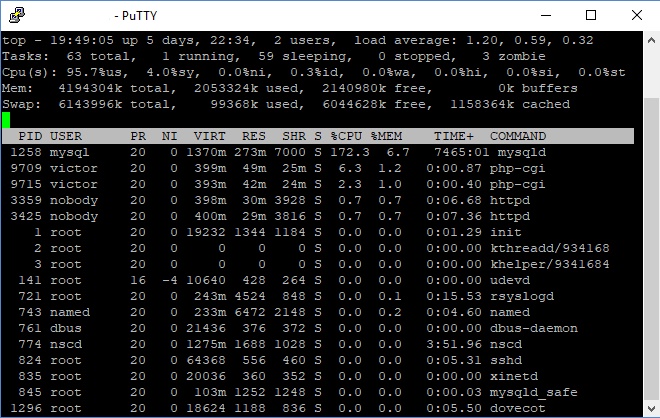
the mysqld process have a lot of cpu usage sometimes (over 170%) and i disabled all stats or error logs (so mysql have not so much queries), but still the problem.
On 1.8.5 version i could not install zeroMQ. Is it possible that this is the problem?
It is unlikely that a missing XMR would cause the issue.
It would be useful to track down the root cause of the internal server error, which means looking in the logs and possibly putting the CMS into test mode, which should expose more information.
We’d expect 1.8 to be faster that 1.7, so I am sure something is wrong.
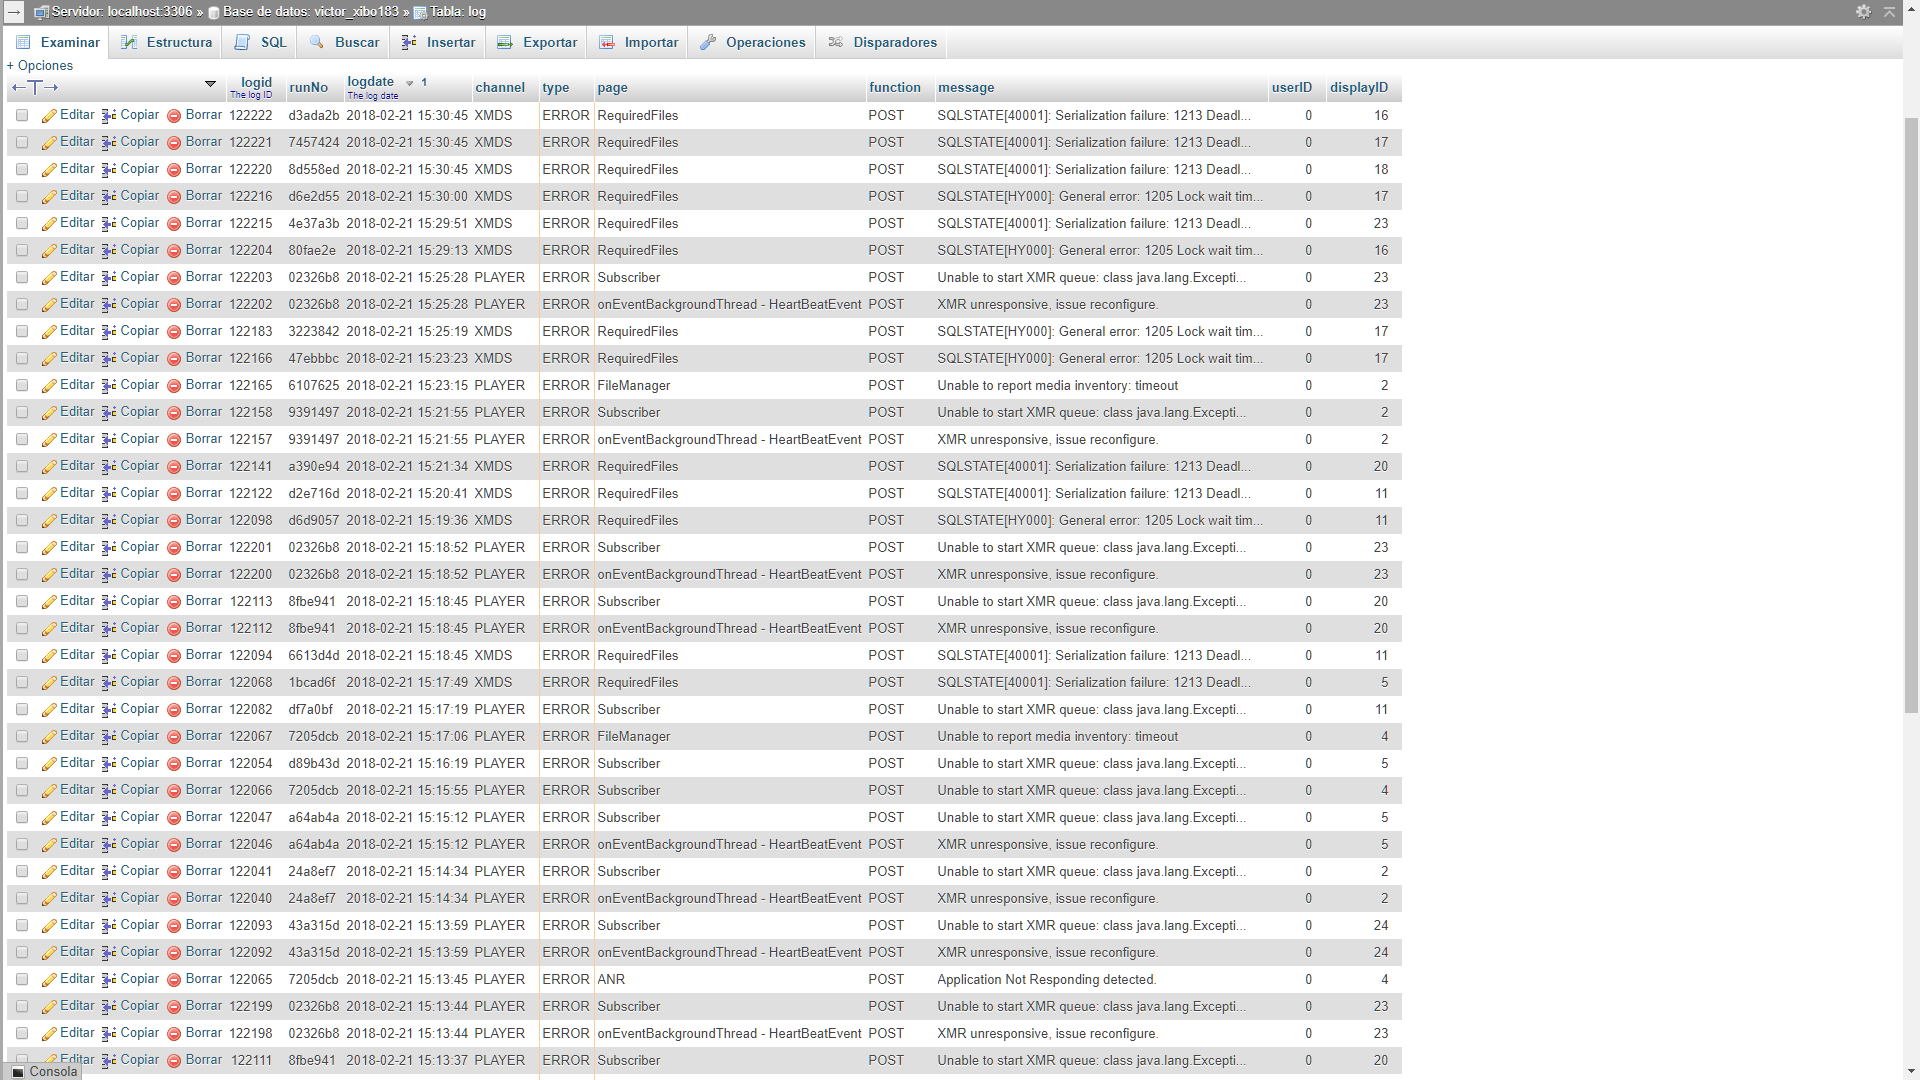
The Player errors point towards you needing to check your XMR configuration - as you’ve not been able to install it correctly you need to set the XMR public address to empty, otherwise it will continue to try and communicate via XMR.
The XMDS errors relate to deadlocks and would usually point to an under powered MySQL server (i.e. it is struggling with the demand). We cache an awful lot of XMDS data, so its surprising that you have so many errors here.
You’d need to do some deadlock analysis to work out what exactly was causing the issue. As you have very high CPU load, it would be interesting to see which process that is specifically - if its MySQL, perhaps there are some run-away database tables causing an issue (you could look at the row counts of each table to see if there is anything unusual).
I’d suggest fixing problem 1, truncating the logs and seeing if the deadlock issues remain as a result.
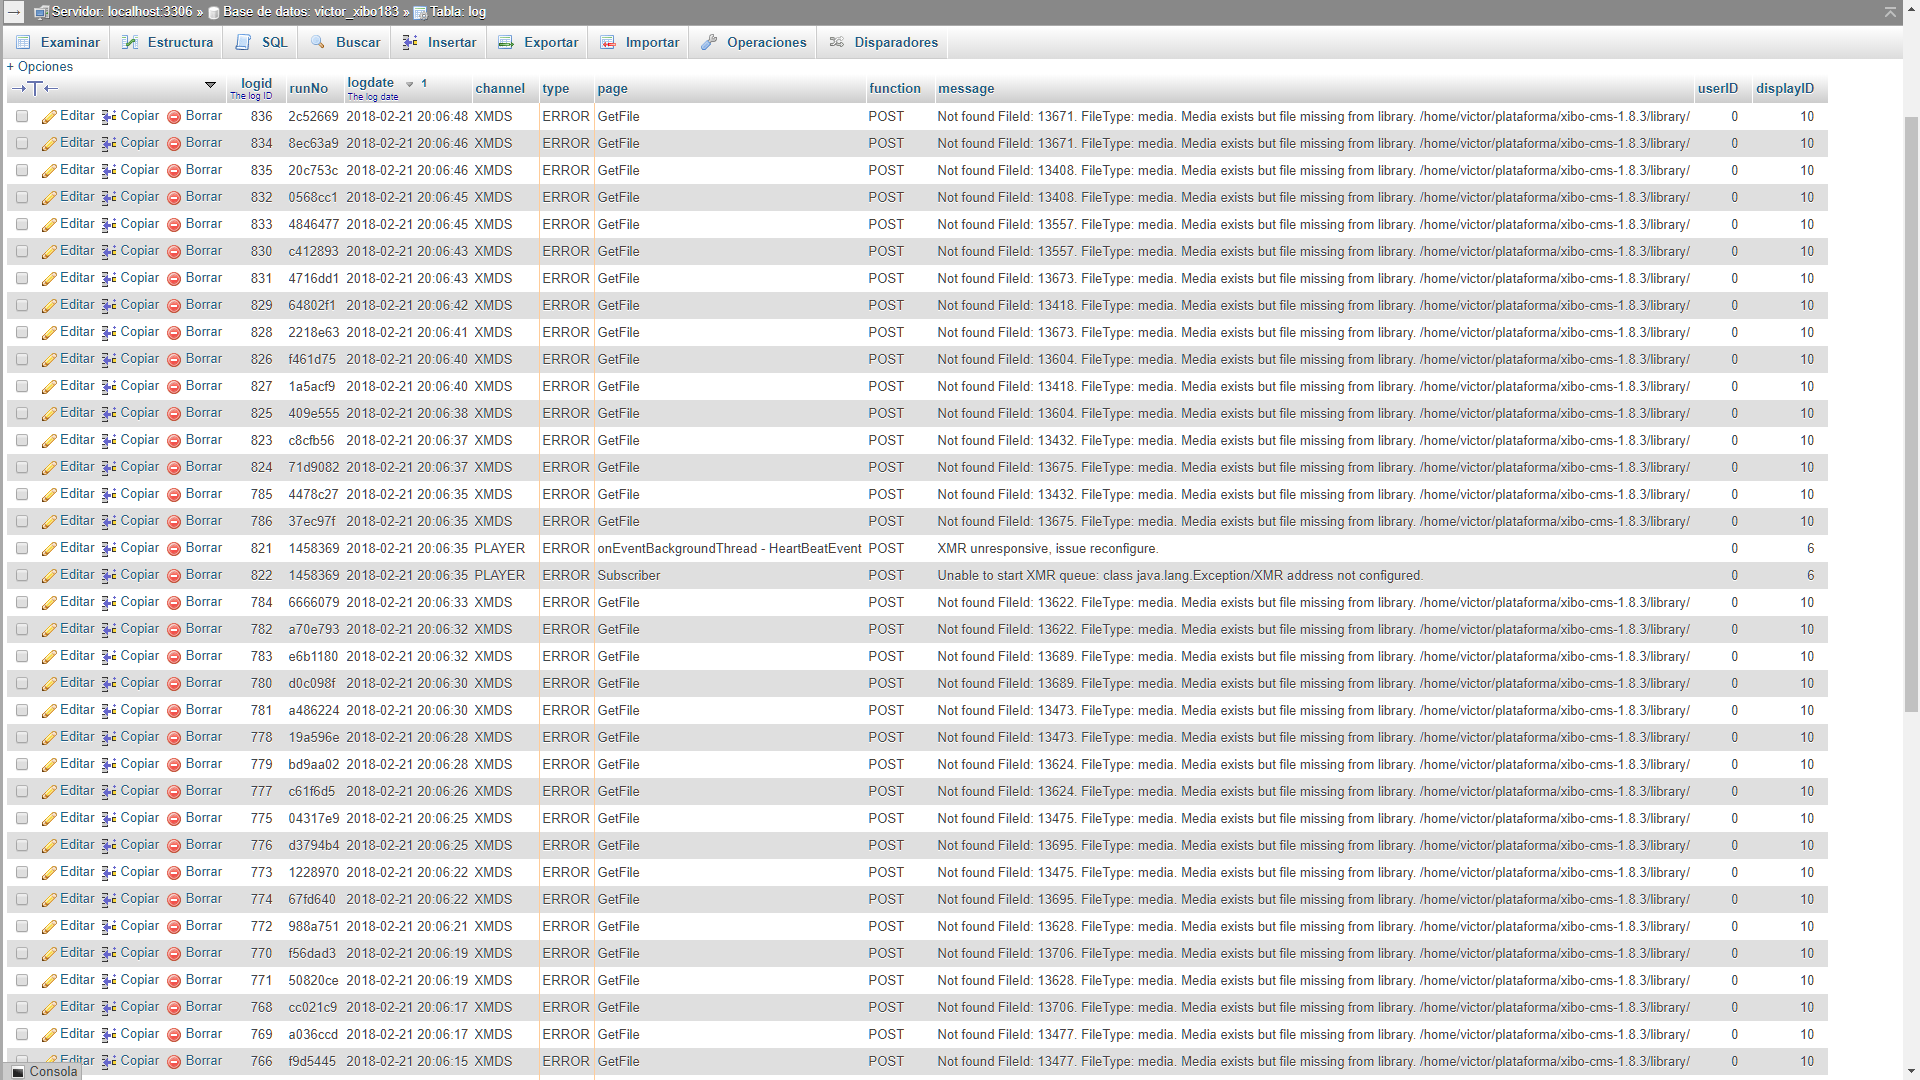
“XMR address not configured” is fine, we do log that on empty address (i’m not sure why actually, that should probably be an “info” event - but anyway that is not the cause of your problem).
The other message you’ve posted means that the displays are requesting files that do not exist in the CMS anymore, perhaps due to an outdated cache. I’d be inclined to try deleting the cache (by default in /library/cache)
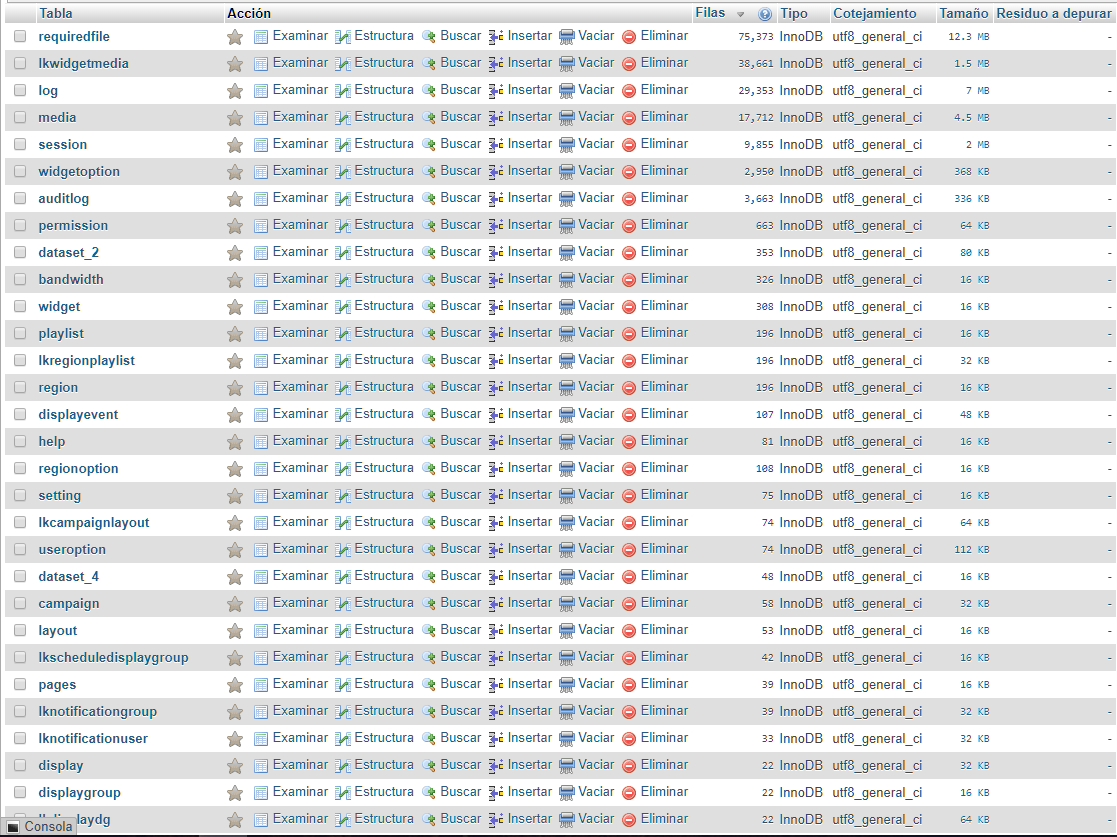
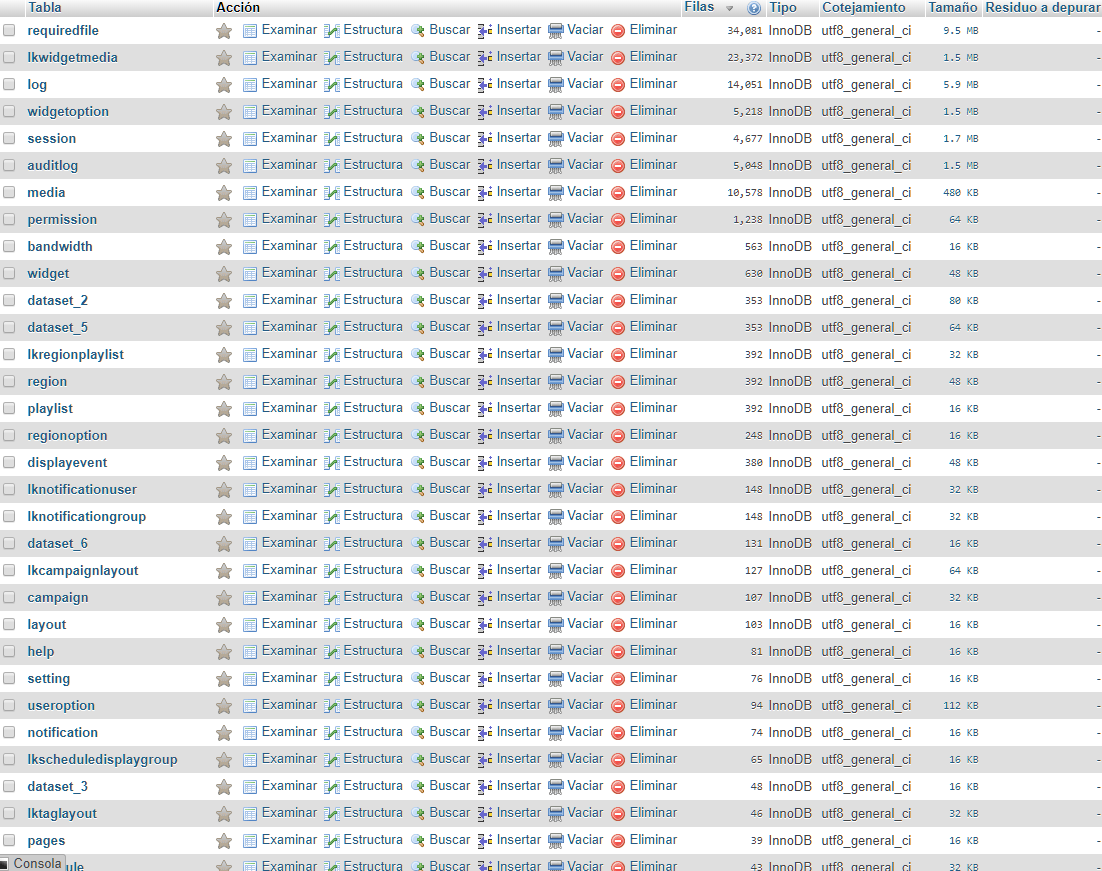
Were you able to see if you have any large tables?
Thanks Dan. i just delete the content inside cache folder (I will keep an eye on the log). I don’t know if this screenshoot is useful for row counting:
Clearly the layouts don’t have so many files. A tipical layout of the cms has about 5 images and 5 videos. A few twitter (10 or 15), weather, clock, date, and maybe a dataset.
Well, we already found the source of the problem! Now, what could be the solution?
This is most likely the problem - 10 or 15 searches will generate a few hundred tweets (i guess) and 2 images per tweet? What sort of search parameters / limits have you got set up on the Twitter feeds?
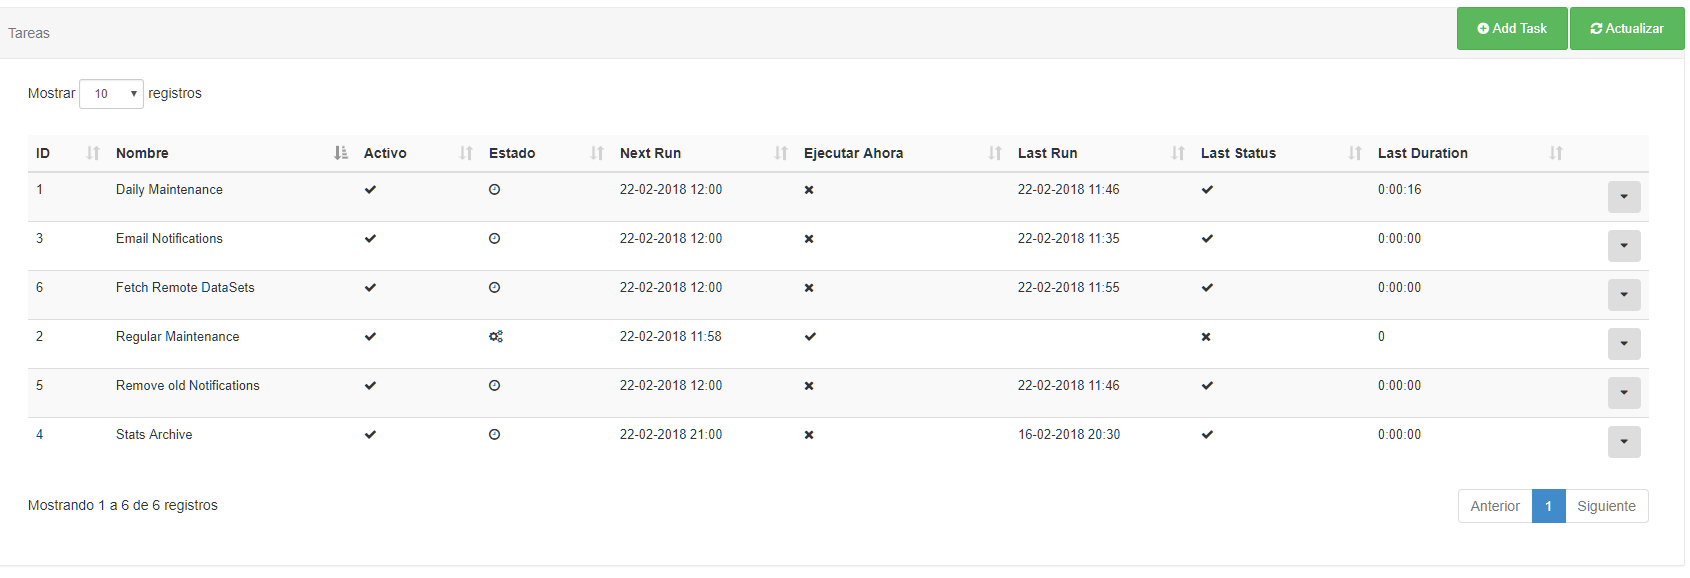
Regular maintenance hasn’t ever run by the looks of it (nothing in last run date). I am sure that will be part of the issue - perhaps its hitting deadlocks or something.
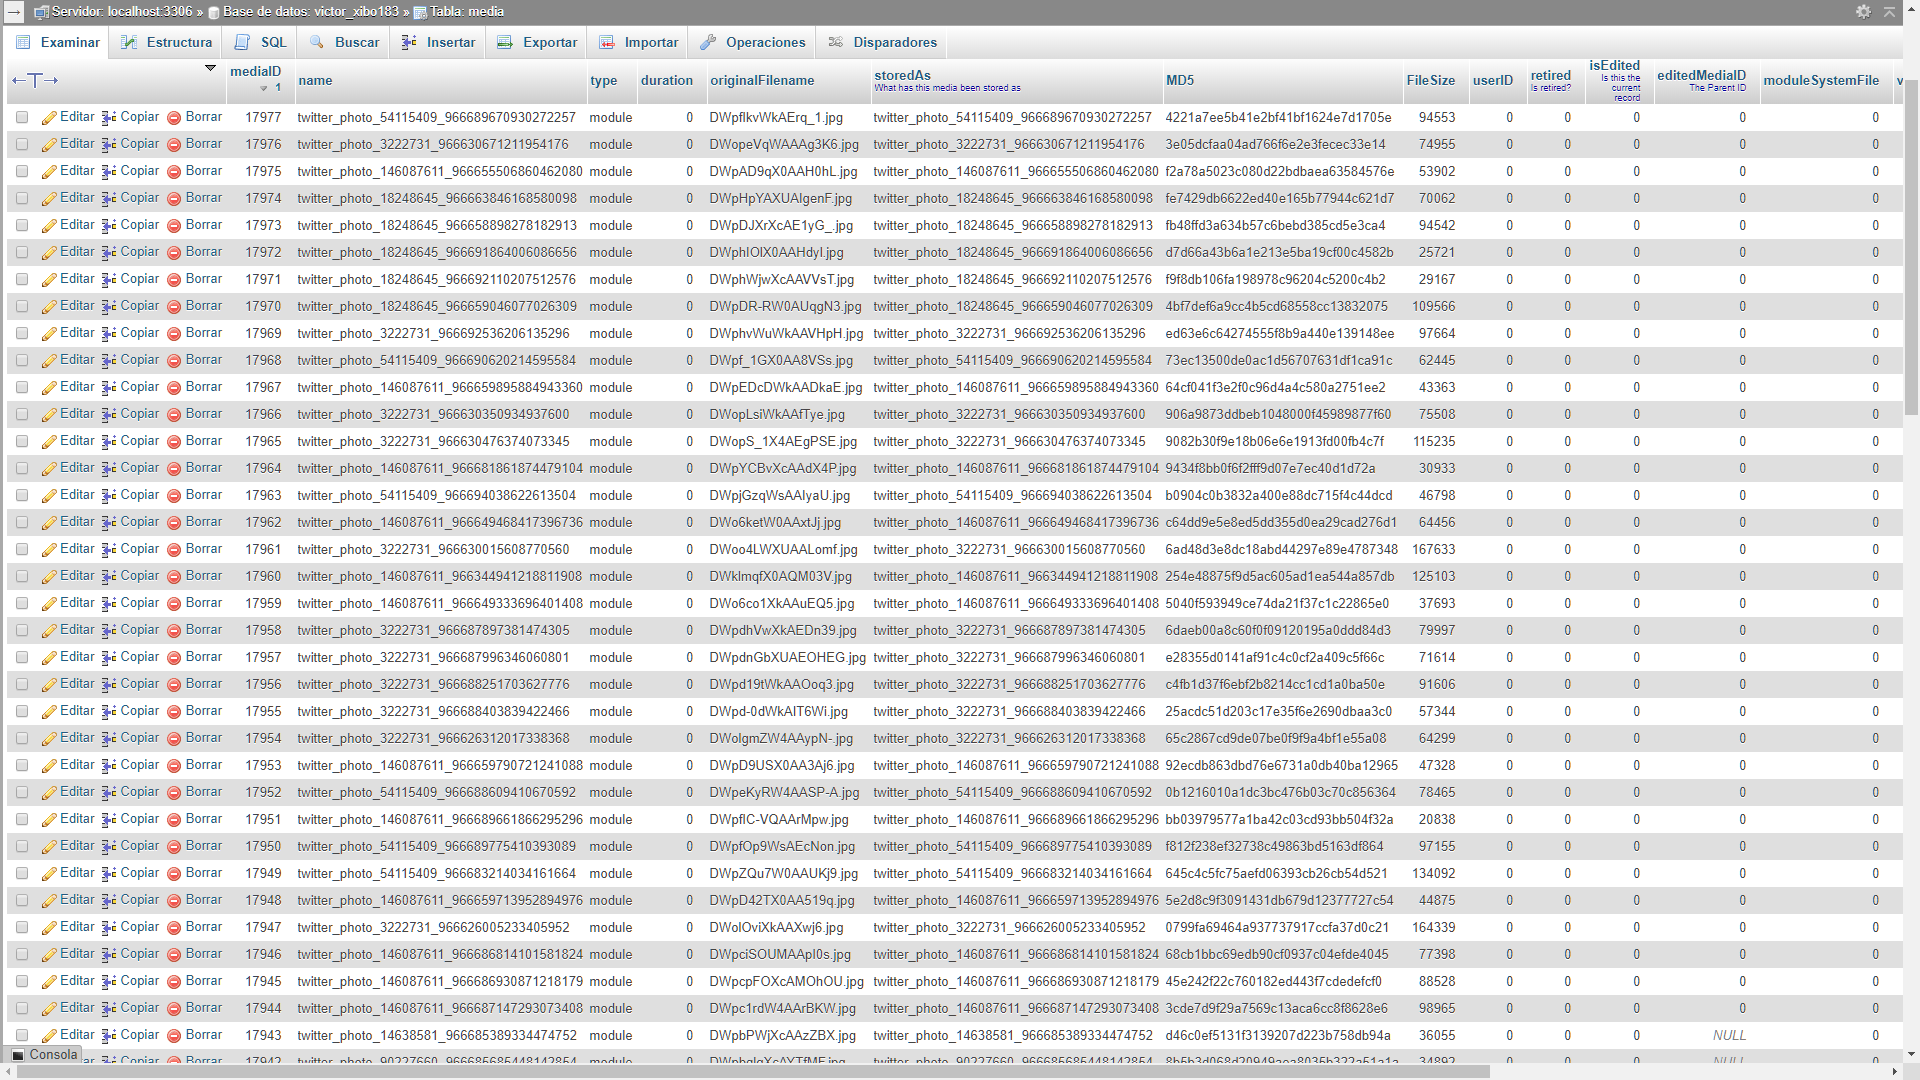
I’m not sure where the 17k media records are coming from - it looks like that twitter search would only return 10 tweeks - max 20 images.
I just can’t see why there would be that many - would you mind providing an export of your layout for us to try? You can upload to transfer.xibo.org.uk and PM me the link.
Your regular maintenance will eventually time out and try again.
Can you run the following SQL?
SELECT COUNT(*)
  FROM `media`
 WHERE mediaId NOT IN (
    SELECT mediaId
       FROM `lkwidgetmedia`
 )
 AND type = 'module'
That will tell us how many of those are not in-use right now.
If that gives a low number then I really don’t know what to say - perhaps your layout export will shed some light on it.
Well, they are all used then - that is a lot of data!
I’d be interested to see one of your Layouts so that we can examine your use case in more detail. Better yet would be a ZIP of your DB and library so that we can restore here to see if there are any optimisations that can be made.
Hi Dan, I would like to consult again on this issue… I finally had to do a new and clean installation…
CMS: 1.8.6 / on VPS (hostgator). / 28 screens.
Again im having this Internal server error (error 500) mainly when I load a layout with several regions. some regions quickly show error 500. when I reload the whole page, sometimes it loads all regions well. The elements are simple: clock, text, pdf or twitter. Random sometimes go wrong.
I think the problem could be in the ‘requiredfile’ table … It grows very fast. I guess it’s twitter. I have different layouts (about 20) but each one requests 5 different tweets every 60 minutes. The problem is that the information is always saved (i think). Should not it be cleaned automatically after certain hours?
The tasks work perfect by the way.
Maybe this is important, when i do:
select count(*) from `requiredfile` where path like '%twitter_photo%'
Hi Dan, I would like to ask again regarding this… I have empty the public adress, but players still trying to connect and generates a lot of ERROR: Unable to start XMR queue: class java.lang.Exception/XMR address not configured. or XMR unresponsive, issue reconfigure.
I have 1.8.9 version install, This should not happen, right?