Hi all,
I want to implement an ‘events this week’ column in a sidebar on my main layout. Ideally I envisage a dataset with five columns (mon-fri) and then events added as data. I would then need to conditionally display this in a formatted ticker but would want to only show the remaining days of the week, ie not display Mondays events on a Tuesday etc.
However this is where I’ve got a bit stuck and wondered whether what I’m trying top achieve is possible and how I should best achieve it?
I mean only structure you can more events on some days etc, that doesn’t really matter that much.
I think you can have 2 options here, 1 would involve editing it a little bit everyday and second should be fine, but it will involve one more column and a bit larger dataset I guess.
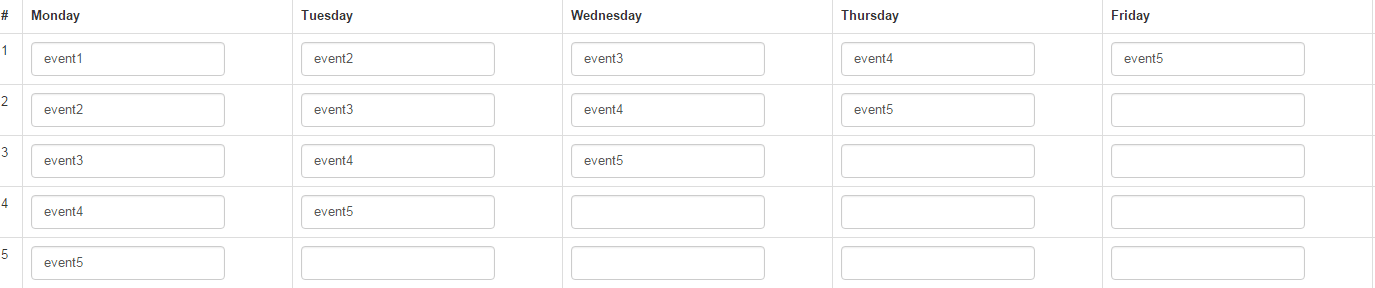
Option 1
Just the above in the dataset, then in ticker you can have [Tuesday|12] for example, and that’s the point which you would need to edit everyday.
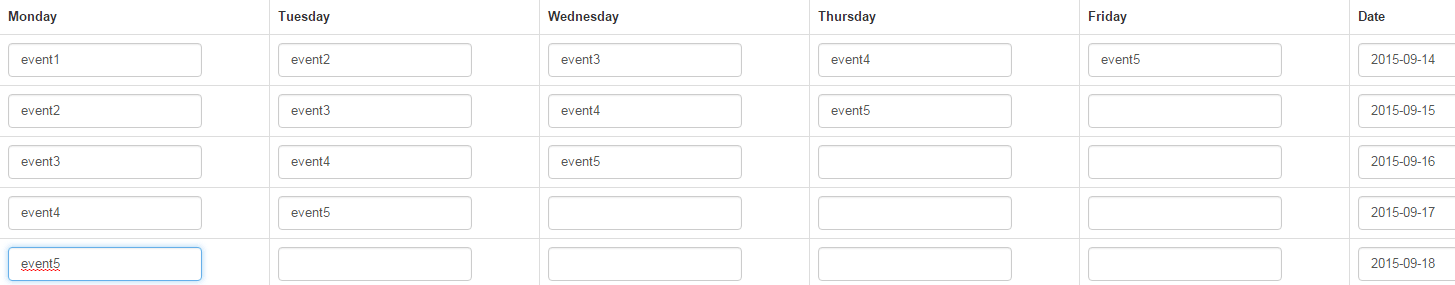
Option 2
Probably a better option, it would involve a Date column and filter, so structure like this:
Hi thanks for the detailed response.
Option two is what I’m looking for I think. Is the appearance you produced still for a ticker in the actual layout?
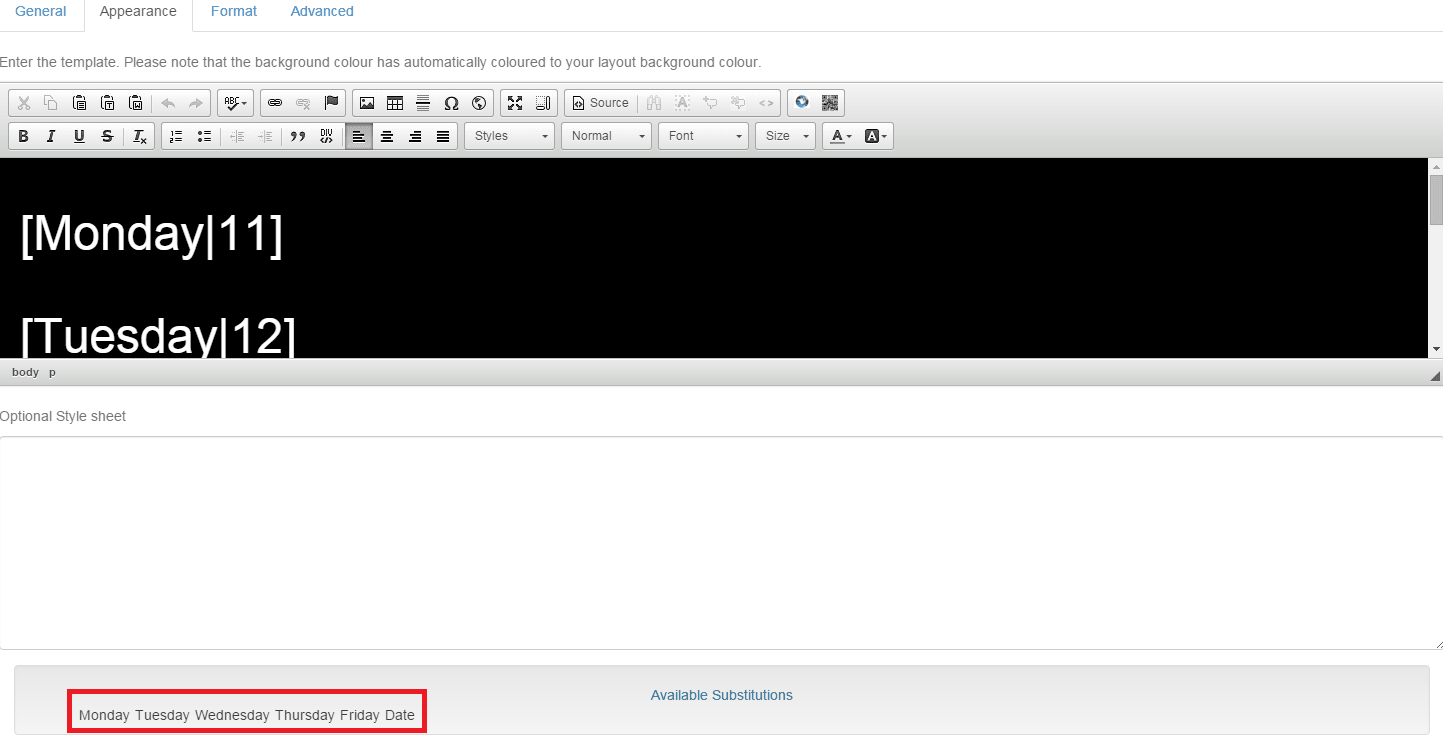
Also stupid question but what are the numbers after the days in the appearance section?
Yup, when you edit ticker you have few tabs (well 4 to be exact), in general tab you will want to use filter, in appearance tab you will want to use substitutions (and probably normal text and/or css) as for numbers, they will be there automatically and they corresponds with row/column position.
Am I correct in assuming that this is the correct layout of the dataset: (sorry I can’t upload a screenshot)
Mon_____Tues_____Wed_____Date
Mon 1_____________________2015-09-14
Mon 2_____________________2015-09-14 Tues 1____ 2015-09-15 Tues 2____ 2015-09-15
…and so on with the date on the same row as the actual event?
The formatting you provided works great but (and I may be pushing it here!) is there anyway to display the next day (or next few days) as well as the current day but obviously not to display anything old from the previous day?
and the overall structure (and appearance) like in my example, for let’s say
15.09.2015 it will display event2 event3 event4 event5
for 16.09.2015 it will display event3 event4 event5
So current and next ones, well basically whole row with that date.
So idea was that on let say Monday 14.09.2015 you have all the events then on Tuesday all events minus the one that was on Monday (event1).
Of course my example is probably simpler that what you will want to achieve, because I had 1 event per 1 day.
So you can have more than one row with the same date, then you would need to amend data in other rows.
You can have more columns (like I think you wanted to have) ie Mon Mon Mon Tue…etc
You could drop the idea of Mon-Fr and just event in new columns and give them description in the data rows.
You know there is few ways in which you can do that.
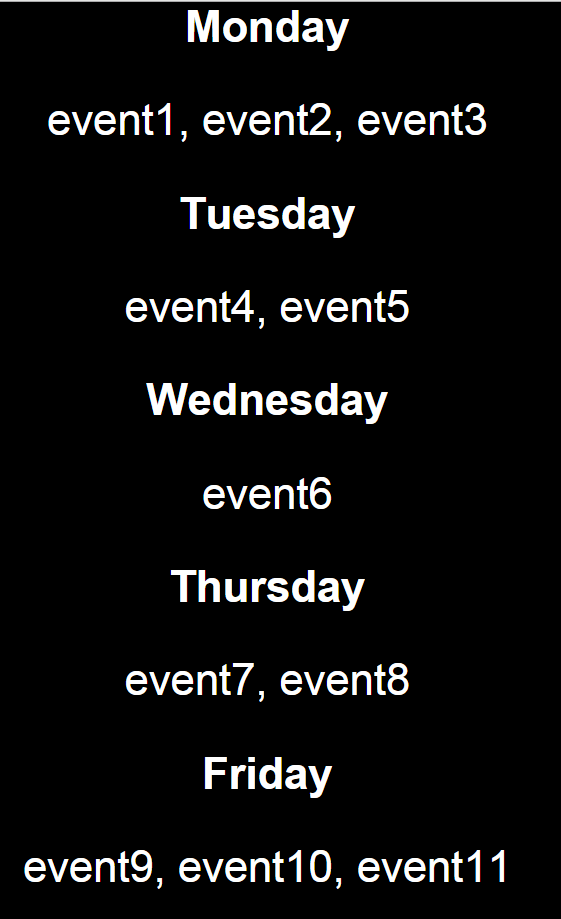
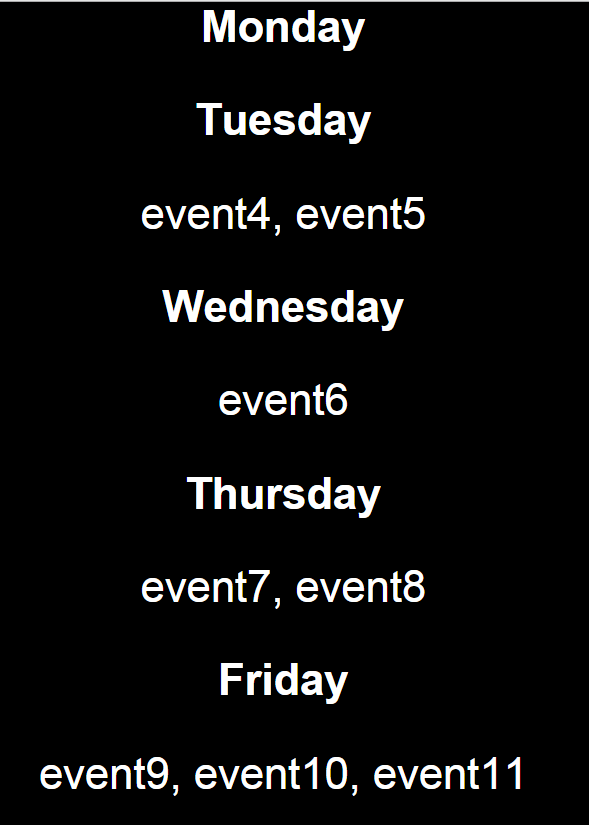
My personal favourite method would be, to have more than one event in the same cell like this:
A problem of putting more than one event into one cell is that the formatting is lost and the cell just becomes a string of text. Is there any work around this?
Yeah it could be a problem, kind of depending on how long are the names you want to use for your events too.
I don’t know how exactly want you to achieve (formatting wise) and what data you want to use.
But I hope that my examples and suggestions will help you make it work.
I’ve actually done it this way in the end by modifying your filter:
Today:
DAY(Date) = DAY(CURDATE()) AND MONTH(Date) = MONTH(CURDATE())
Tomorrow:
DAY(Date) = DAY(CURDATE()+1) AND MONTH(Date) = MONTH(CURDATE())
or both on the same in the same region:
DAY(Date) = DAY(CURDATE()) AND MONTH(Date) = MONTH(CURDATE()) OR DAY(Date) = DAY(CURDATE()+1) AND MONTH(Date) = MONTH(CURDATE())