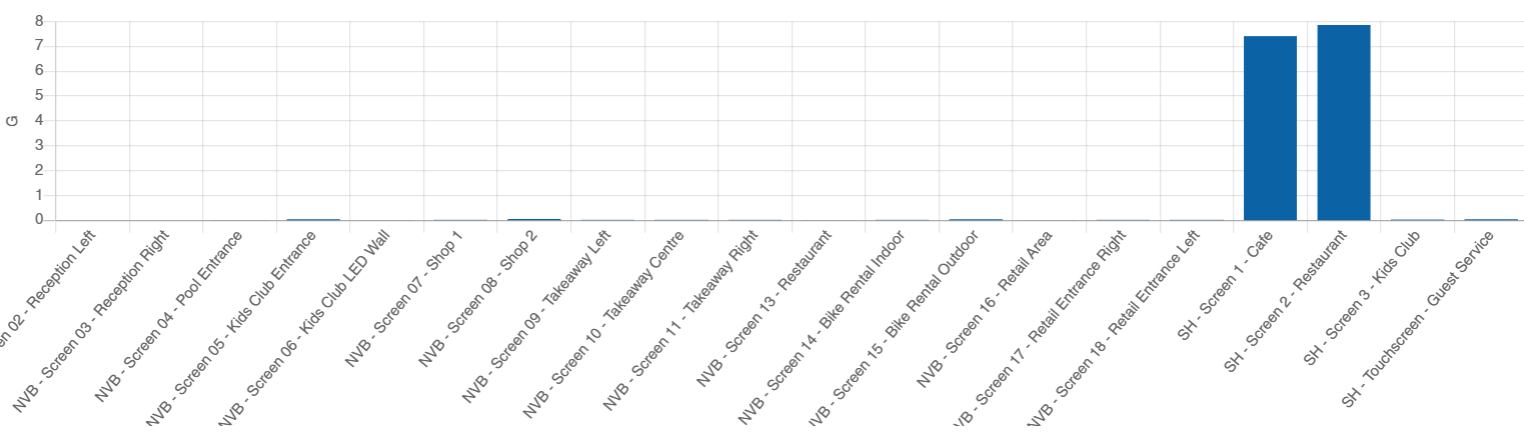
We have just deployed 21 screens for a client and i am wondering why the bandwidth for two of the screens is showing 10Gb this month in the CMS instance. Am i missing something in the setup or is there a way for the DS players to store the media locally?
All Player types download content locally before displaying it, so assuming that content isn’t changing rapidly, you would expect much lower BW usage. So this is likely configuration.
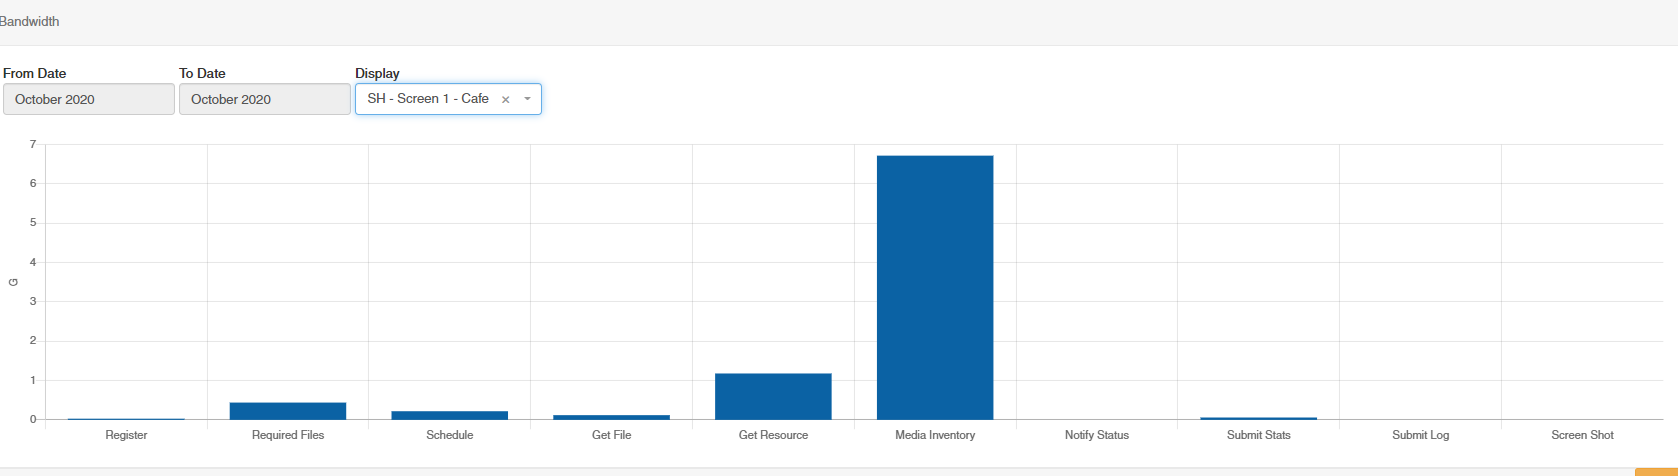
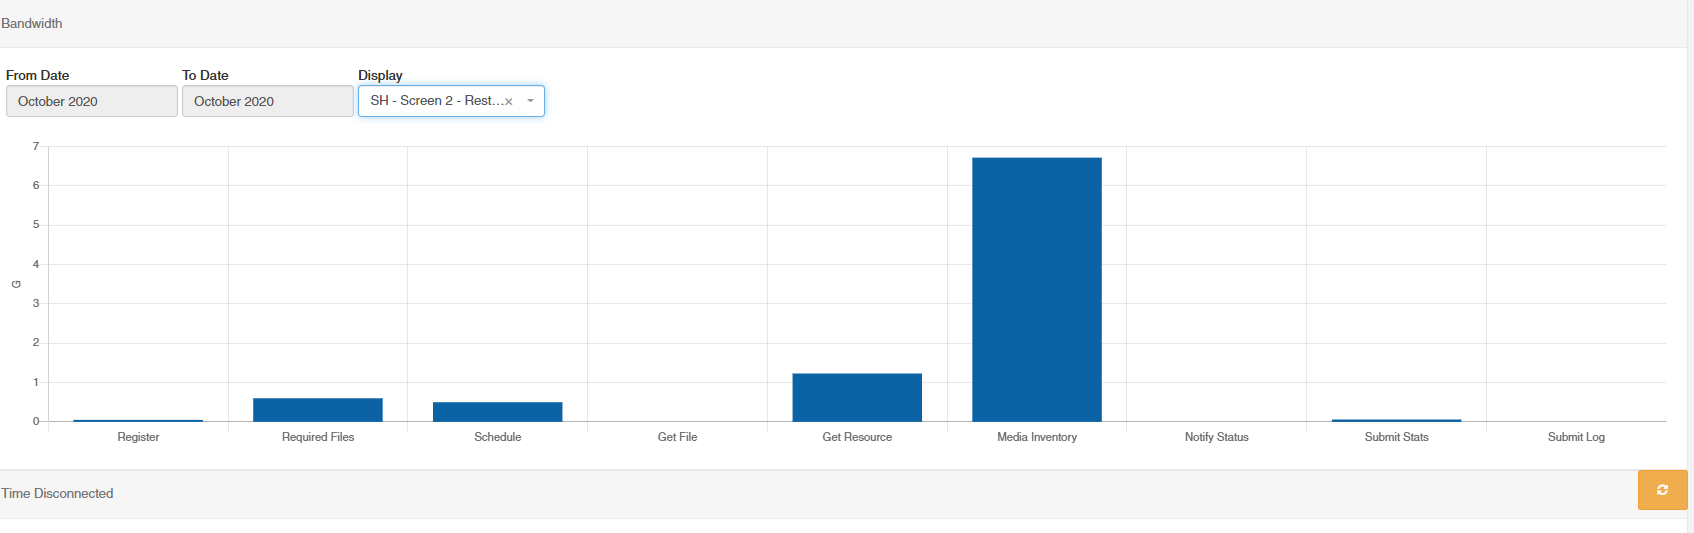
You’ll need to work out which of the communications is using all of that - you can do this on the bandwidth chart by selecting one of the displays in the filter. The chart will change to showing a bar per communication type.
We can then have some more guesses as to what might be happening.
We don’t have a setting to disable caching of content, its the only way. Something is preventing that from happening - the above chart will give us a clue what.
That is interesting, Media Inventory is where the Player reports the status of its files back to the CMS after it has “checked in”. To have 6G of that data (essentially just some XML) seems excessive and a bit strange. It should only be matching the content of Required Files, which is clearly much smaller.
Can you enable auditing on one of those displays for a short period of time, and then collect a Report Fault troubleshoot.zip file so that we might see what is being logged?
Thanks, I’ve deleted the link in case there is anything in the file you did not want visible to the public. In future you can private message any logs that are requested.
Unfortunately there isn’t anything of note in the log file, so I think perhaps you missed a step? There is a FAQ for enabling logging on the Player which will help: Display Client Logs.
For reference if your MediaInventory is consuming that much bandwidth, then enabling logging on it, allowing it 30 mins or so to run should produce a fairly large troubleshoot.zip file. I’d be expecting in the MB size range.
Unfortunately there still isn’t any player logging in that file but I can see that you do have it switched on for 2 displays.
This can only mean that they didn’t connect at all during your 30 minute log window.
If I can suggest that you turn OFF the overall CMS logging in settings, and leave the display auditing switched ON, and then watch the players have connected at least several times before collecting the file.
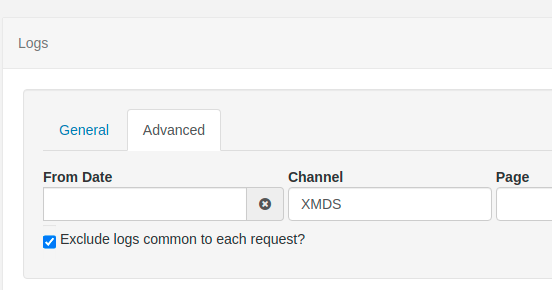
You can see the logs directly to ensure they have been collected, go to the Advanced → Log page, and in the filter set the channel to XMDS:
I hope that makes sense?
To be honest I expected them to be connecting very frequently to generate that much bandwidth usage, so I am a little confused.