1.7.7 player keeps crashing

Continuing the discussion from Xibo player has stopped working:

@dan

I appreciate the initial response to my post regarding the player crashing. I do have some further information:

I do not yet have java installed on this computer.

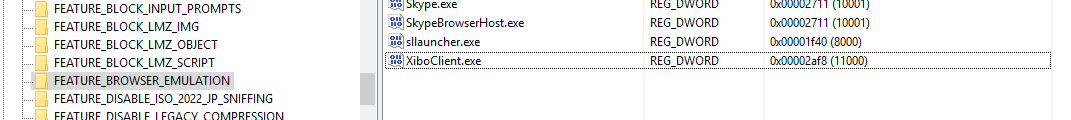
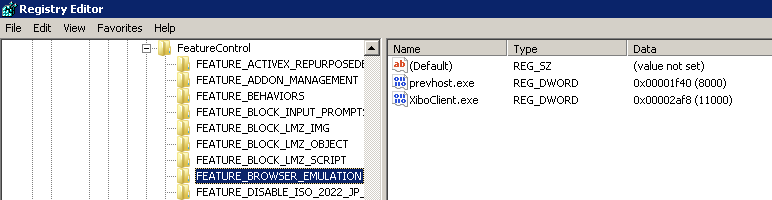
I do not have any IE add-ons installed on this computer.

This is a very minimal installation. I wanted a computer that had as few extras as I could get away with, as the goal is to have it in an office that is almost 200 miles away, and I don’t want people in that office to be tempted to play with it in any way.

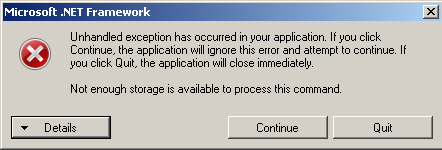
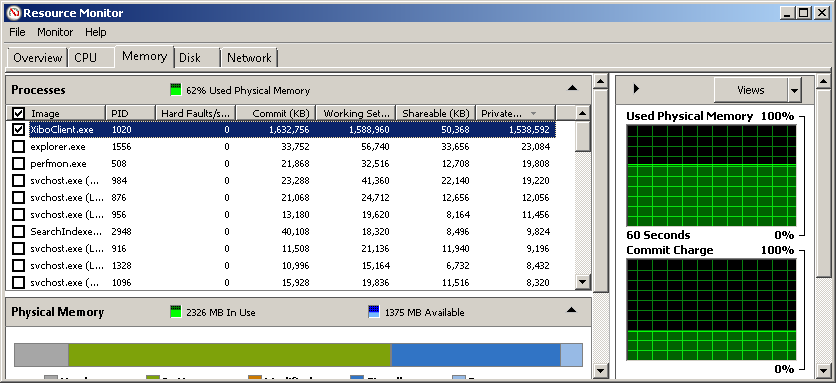
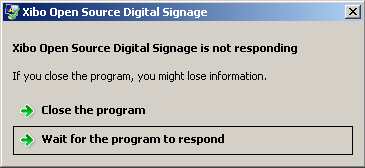
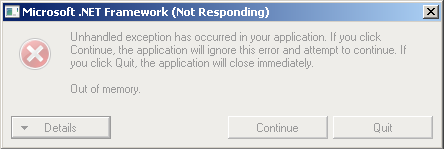
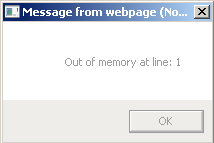
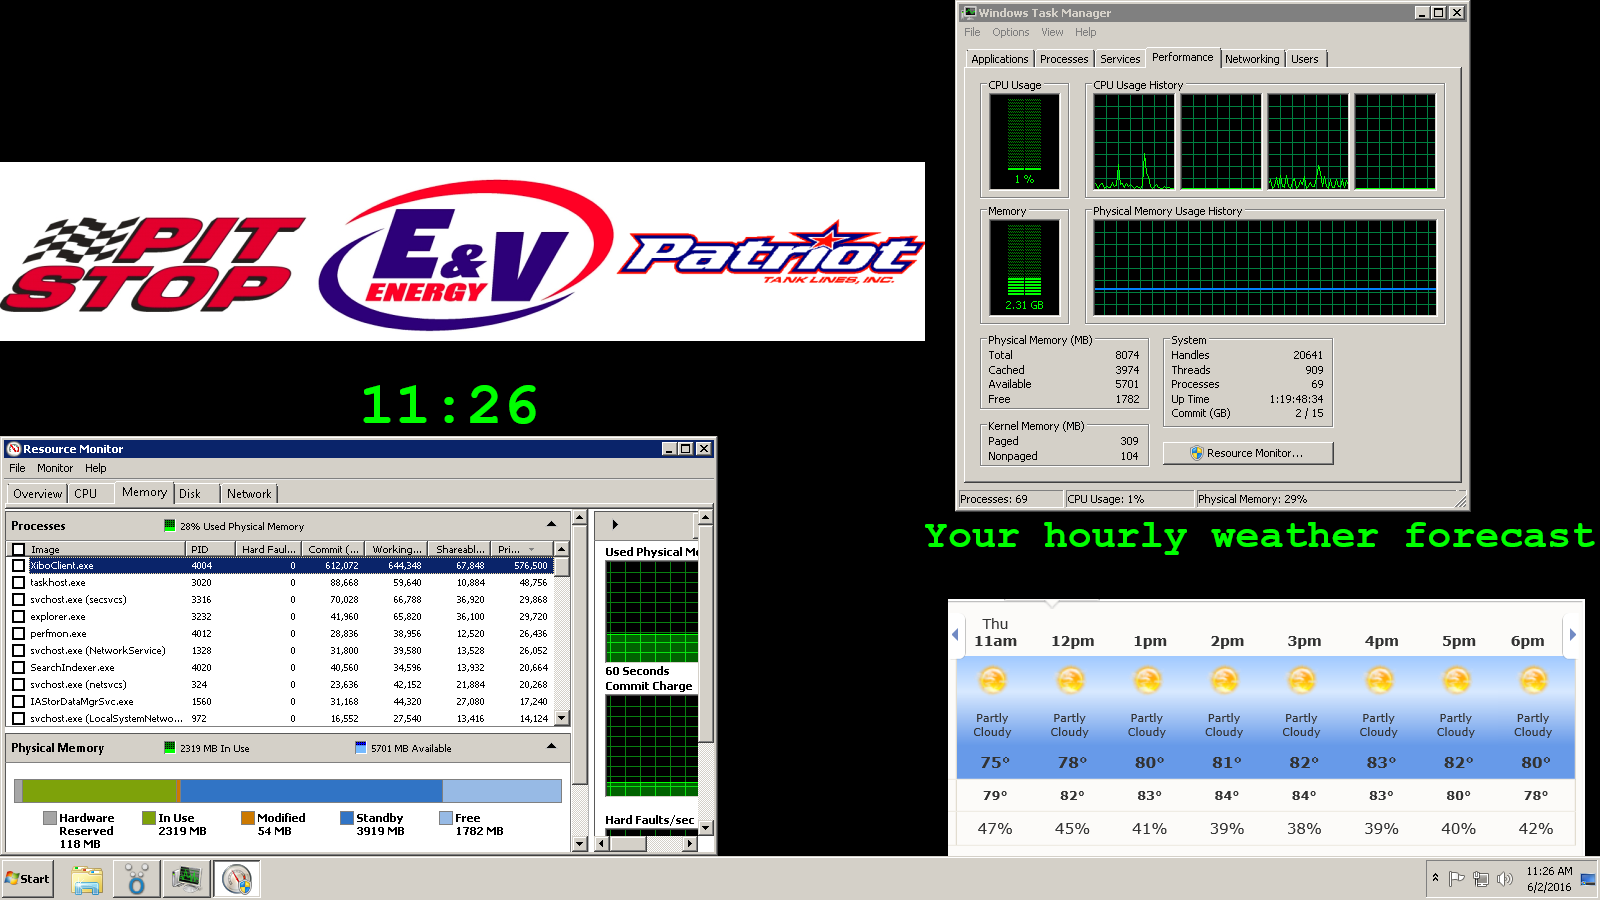
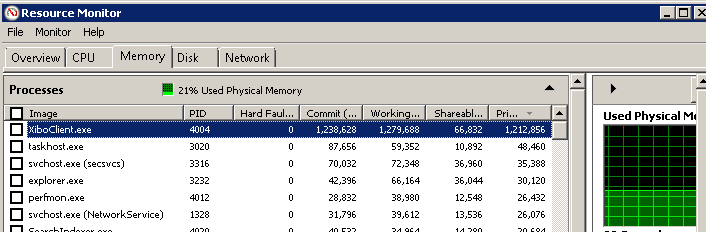
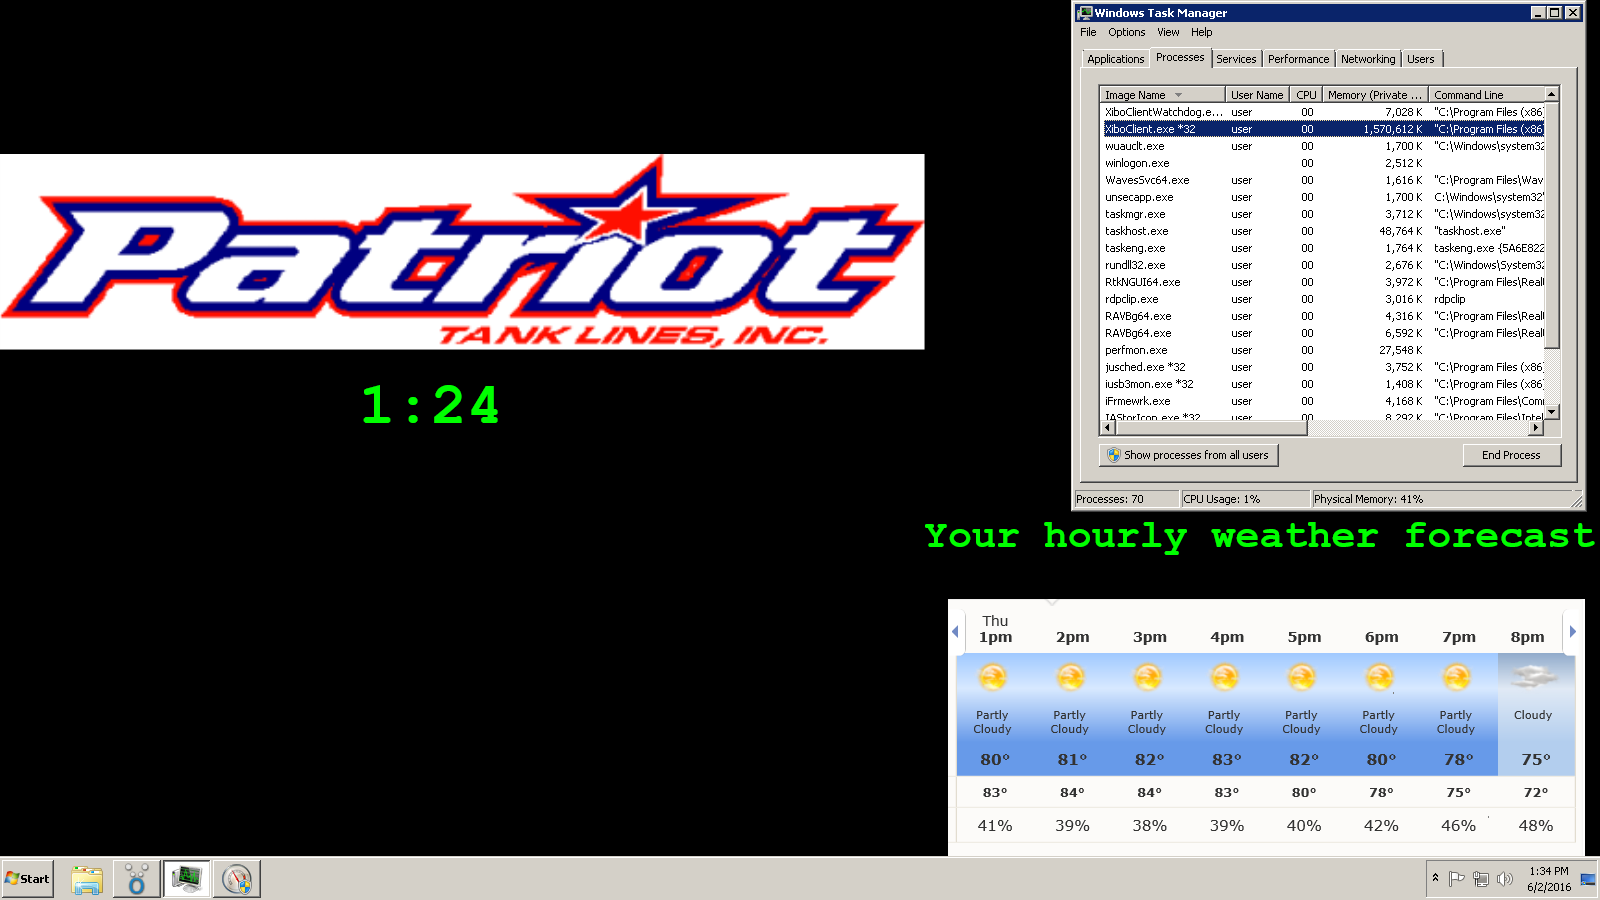
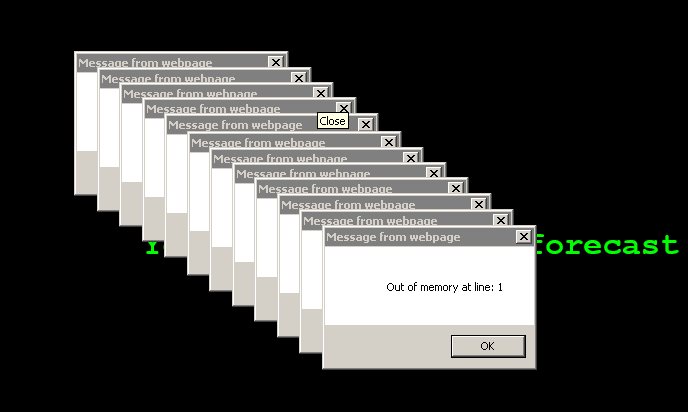
That being said, I found your response very interesting, because the other thing I I have seen on this minimal install computer is an OOM error:

Log Name:      Application
Source:        .NET Runtime
Date:          5/13/2016 3:01:18 PM
Event ID:      1026
Task Category: None
Level:         Error
Keywords:      Classic
User:          N/A
Computer:      Xibo1
Description:
Application: XiboClient.exe
Framework Version: v4.0.30319
Description: The process was terminated due to an unhandled exception.
Exception Info: System.OutOfMemoryException
   at XiboClient.Log.ClientInfo.AddToLogGrid(System.String, XiboClient.LogType)
   at XiboClient.Log.ClientInfoTraceListener.Write(System.String, System.String)
   at XiboClient.Log.ClientInfoTraceListener.WriteLine(System.Object, System.String)
   at System.Diagnostics.TraceInternal.WriteLine(System.Object, System.String)
   at XiboClient.XmdsAgents.ScheduleAgent.Run()
   at System.Threading.ThreadHelper.ThreadStart_Context(System.Object)
   at System.Threading.ExecutionContext.RunInternal(System.Threading.ExecutionContext, System.Threading.ContextCallback, System.Object, Boolean)
   at System.Threading.ExecutionContext.Run(System.Threading.ExecutionContext, System.Threading.ContextCallback, System.Object, Boolean)
   at System.Threading.ExecutionContext.Run(System.Threading.ExecutionContext, System.Threading.ContextCallback, System.Object)
   at System.Threading.ThreadHelper.ThreadStart()


Event Xml:
<Event xmlns="http://schemas.microsoft.com/win/2004/08/events/event">
  <System>
    <Provider Name=".NET Runtime" />
    <EventID Qualifiers="0">1026</EventID>
    <Level>2</Level>
    <Task>0</Task>
    <Keywords>0x80000000000000</Keywords>
    <TimeCreated SystemTime="2016-05-13T19:01:18.000000000Z" />
    <EventRecordID>982</EventRecordID>
    <Channel>Application</Channel>
    <Computer>Xibo1</Computer>
    <Security />
  </System>
  <EventData>
    <Data>Application: XiboClient.exe
Framework Version: v4.0.30319
Description: The process was terminated due to an unhandled exception.
Exception Info: System.OutOfMemoryException
   at XiboClient.Log.ClientInfo.AddToLogGrid(System.String, XiboClient.LogType)
   at XiboClient.Log.ClientInfoTraceListener.Write(System.String, System.String)
   at XiboClient.Log.ClientInfoTraceListener.WriteLine(System.Object, System.String)
   at System.Diagnostics.TraceInternal.WriteLine(System.Object, System.String)
   at XiboClient.XmdsAgents.ScheduleAgent.Run()
   at System.Threading.ThreadHelper.ThreadStart_Context(System.Object)
   at System.Threading.ExecutionContext.RunInternal(System.Threading.ExecutionContext, System.Threading.ContextCallback, System.Object, Boolean)
   at System.Threading.ExecutionContext.Run(System.Threading.ExecutionContext, System.Threading.ContextCallback, System.Object, Boolean)
   at System.Threading.ExecutionContext.Run(System.Threading.ExecutionContext, System.Threading.ContextCallback, System.Object)
   at System.Threading.ThreadHelper.ThreadStart()

</Data>
  </EventData>
</Event>

Again, this is a minimal version of Windows 7 SP1. I don’t have any frills installed. That being said, if you have any further advice or if I can provide any additional details, I am more than happy to work with you, including extracting the error logs and attaching them here.

I am also seeing problems on another computer, but as they appear to be related to CEF, I will put together another post for them shortly.

Thank you again for your time!

Chris

This is a dll for JavaScript which is required by the WebBrowser - not Java. This file should be present and registered on all PC’s.

Its trying to add another log message to the internal grid of log data. This will be cleared automatically at 500 messages, which is quite low, given that most log messages are quite small.

Can you open task manager when Xibo is running and see if XiboClient.exe’s memory usage increases over time? Or perhaps there is something else consuming a lot of memory.

We will be removing CEF in 1.8 as a failed experiment (which is why it is off by default). We couldn’t make it reliable, or render as nicely as IE. If you aren’t using it for any particular reason it might be better to turn it off.

Thanks,
Dan

I readily admit that I am not yet an accomplished Windows admin. I have been using Linux for a number of years, now, and am just entering an environment where the majority of what I am doing is Windows. Therefore, please forgive me for any lack of knowledge in administering the system on which I have placed the player. I will continue to learn.

I am continuing to see problems with the player crashing. I have attempted to monitor and find the problem, but I am not sure even how to do this on this computer, and I feel that I am struggling to even describe what I am seeing correctly as a result. As such, here is the information I have gathered following yet another crash of the player:

When I clicked the Details button on the above window, I got the following information:

See the end of this message for details on invoking
just-in-time (JIT) debugging instead of this dialog box.

************** Exception Text **************
System.ComponentModel.Win32Exception: Not enough storage is available to process this command
at System.Drawing.BufferedGraphicsContext.CreateCompatibleDIB(IntPtr hdc, IntPtr hpal, Int32 ulWidth, Int32 ulHeight, IntPtr& ppvBits)
at System.Drawing.BufferedGraphicsContext.CreateBuffer(IntPtr src, Int32 offsetX, Int32 offsetY, Int32 width, Int32 height)
at System.Drawing.BufferedGraphicsContext.AllocBuffer(Graphics targetGraphics, IntPtr targetDC, Rectangle targetRectangle)
at System.Drawing.BufferedGraphicsContext.AllocBufferInTempManager(Graphics targetGraphics, IntPtr targetDC, Rectangle targetRectangle)
at System.Drawing.BufferedGraphicsContext.Allocate(IntPtr targetDC, Rectangle targetRectangle)
at System.Windows.Forms.Control.WmPaint(Message& m)
at System.Windows.Forms.Control.WndProc(Message& m)
at System.Windows.Forms.ScrollableControl.WndProc(Message& m)
at System.Windows.Forms.ContainerControl.WndProc(Message& m)
at System.Windows.Forms.Form.WndProc(Message& m)
at System.Windows.Forms.Control.ControlNativeWindow.OnMessage(Message& m)
at System.Windows.Forms.Control.ControlNativeWindow.WndProc(Message& m)
at System.Windows.Forms.NativeWindow.Callback(IntPtr hWnd, Int32 msg, IntPtr wparam, IntPtr lparam)

************** Loaded Assemblies **************
mscorlib
Assembly Version: 2.0.0.0
Win32 Version:
CodeBase: file:///C:/Windows/Microsoft.NET/Framework/v2.0.50727/mscorlib.dll

XiboClient
Assembly Version: 2.0.0.0
Win32 Version: 2.0.0.0
CodeBase: file:///C:/Program%20Files%20(x86)/Xibo%20Player/XiboClient.exe

System
Assembly Version: 2.0.0.0
Win32 Version:
CodeBase: file:///C:/Windows/assembly/GAC_MSIL/System/2.0.0.0__b77a5c561934e089/System.dll

System.Windows.Forms
Assembly Version: 2.0.0.0
Win32 Version:
CodeBase: file:///C:/Windows/assembly/GAC_MSIL/System.Windows.Forms/2.0.0.0__b77a5c561934e089/System.Windows.Forms.dll

System.Drawing
Assembly Version: 2.0.0.0
Win32 Version: 2.0.50727.5495 (Win7SP1GDR.050727-5400)
CodeBase: file:///C:/Windows/assembly/GAC_MSIL/System.Drawing/2.0.0.0__b03f5f7f11d50a3a/System.Drawing.dll

System.Configuration
Assembly Version: 2.0.0.0
Win32 Version: 2.0.50727.5483 (Win7SP1GDR.050727-5400)
CodeBase: file:///C:/Windows/assembly/GAC_MSIL/System.Configuration/2.0.0.0__b03f5f7f11d50a3a/System.Configuration.dll

System.Xml
Assembly Version: 2.0.0.0
Win32 Version:
CodeBase: file:///C:/Windows/assembly/GAC_MSIL/System.Xml/2.0.0.0__b77a5c561934e089/System.Xml.dll

System.Management
Assembly Version: 2.0.0.0
Win32 Version: 2.0.50727.5483 (Win7SP1GDR.050727-5400)
CodeBase: file:///C:/Windows/assembly/GAC_MSIL/System.Management/2.0.0.0__b03f5f7f11d50a3a/System.Management.dll

System.Web.Services
Assembly Version: 2.0.0.0
Win32 Version: 2.0.50727.5483 (Win7SP1GDR.050727-5400)
CodeBase: file:///C:/Windows/assembly/GAC_MSIL/System.Web.Services/2.0.0.0__b03f5f7f11d50a3a/System.Web.Services.dll

xnnaygbk
Assembly Version: 2.0.0.0
Win32 Version:
CodeBase: file:///C:/Windows/assembly/GAC_MSIL/System/2.0.0.0__b77a5c561934e089/System.dll

System.Deployment
Assembly Version: 2.0.0.0
Win32 Version: 2.0.50727.5493 (Win7SP1GDR.050727-5400)
CodeBase: file:///C:/Windows/assembly/GAC_MSIL/System.Deployment/2.0.0.0__b03f5f7f11d50a3a/System.Deployment.dll

tge7iezq
Assembly Version: 2.0.0.0
Win32 Version:
CodeBase: file:///C:/Windows/assembly/GAC_MSIL/System/2.0.0.0__b77a5c561934e089/System.dll

qu6eaxcr
Assembly Version: 2.0.0.0
Win32 Version:
CodeBase: file:///C:/Windows/assembly/GAC_MSIL/System/2.0.0.0__b77a5c561934e089/System.dll

************** JIT Debugging **************
To enable just-in-time (JIT) debugging, the .config file for this
application or computer (machine.config) must have the
jitDebugging value set in the system.windows.forms section.
The application must also be compiled with debugging
enabled.

For example:

When JIT debugging is enabled, any unhandled exception
will be sent to the JIT debugger registered on the computer
rather than be handled by this dialog box.

Should I enable JIT debugging?

I also captured the memory usage as it was at the discovery that the player had crashed again. I am not sure how long this computer was in this state at this time, as Windows Event Viewer shows the event being recorded at the time when I closed the dialog and not when it actually occurred. Here is a screenshot of the Resource Monitor that was running at the time:

I can watch the amount of memory used by XiboPlayer.exe go up from an initial ~400,000KB up to what shows in that image. It is slow, but it definitely continues to eat up memory. As you can see, the rest of the items listed are using minimal memory.

For clarity, I have exported the layout I am using, and it can be found here:

The webpage that I am trying to display is weather. I understand that there is a forecast.io module; I have explored it and am not able to get it to do what I need, which is display hourly weather data for the location in which this player will be viewed. The forecast.io module currently shows only 5 days, Current day, Daily, and Picture. Exploration of the forecast.io website seems to indicate that they do not provide that kind of detail, so I have been trying to do it manually.

If there is anything specific that I can do to obtain further troubleshooting information, I am very interested in digging into this. I need this to operate as expected, but have not been able to get it to stay running regardless of any attempts I have made, including using processalive-0.9.exe to keep it running (this fails because the crash requires intervention to get the application to fully close, so processalive never sees it as stopped), scheduling a daily reboot in Task Scheduler (this option works, except that the player always crashes a long time before the reboot, which means the display is not being shown for an indeterminate amount of time), and attempting to use Task Scheduler to simply restart the player if it stopped, but that never worked, either.

Edit: I also attempted to use rundll32 to clear memory on an hourly basis using Task Scheduler, but it didn’t seem to help.

I appreciate all continued efforts here.

Chris

That is a lot of memory to be leaking - once windows gets to that sort of memory usage the active applications will start crashing for all sorts of different errors.

It seems like there are two things to do initially - one for you and one for us.

  • For you (if you don’t mind) would be to get a new layout running on the player which does not contain any external content. The simpler the better actually - so that we can work out whether or not it is the content or the player leaking memory.

  • For us… @Peter, can we import the layout and run it up on a test windows player to see if we also get a memory leak?

That is something I have fixed - completely disabling error reporting for the application and preventing the dialog that requires action to close it. I have also integrated fully the watchdog application to automatically restart Xibo if it disappears from the process list.

I will add you to a PM which has a pre-release to try.

I will certainly try the pre-release soon (perhaps on a different machine for comparison purposes), but I have time that I can spend helping find out where the problem may be, so I will start with a simpler layout and work with you on that for now.

Question: How simple do you want it to be? I can have two images rotate on a 60 second basis for a day or two (or until it crashes, whichever comes first), if you would like, or if you have any suggestions, I am willing to implement any testing that will help. I can also work with logging in any way you might suggest if that will help.

Chris

That would be a good starting place - if that leaks memory then I think we are looking at something specific to your environment (in which case we may need to run a memory profiler).

If that test doesn’t leak memory, then you could add a text item into the rotation (or as well as the rotation in another region).

We’ve run your layout here in the office for a few hours and not had any memory leaking - so I am not sure what to make of that it present.

It could be an “IE issue” in that your machine is running a lower version of IE - have you made the registry changes for rendering in IE11 mode?

I assume you mean from this post:

I would like to tell you that I did take this step, as I did find it while digging through the community for any assistance I could find, but as I mentioned earlier, I am not an experienced Windows admin, yet. I thought I had accomplished it, but when I went to check on it just a moment ago to be sure it was in place, I realized that I had done it wrong. I won’t divulge what I did - suffice it to say it was stupid.

That being said, I have discovered my error in the registry, and will now implement it in the second computer (not the one I sent logs for) and test the layout you have been testing to see if it helps. I have had virtually identical issues on both computers, so this should help in finding out what’s happening.

Thank you for prodding me in the right direction. I will report back tomorrow.

Chris

1 Like

Good morning.

I have two computers with the player on them. The first one is the one for which I sent crash information, and the one on which I enabled the simplified layout yesterday. I made the addition to the registry on the second one, then enabled the external content layout I submitted for testing/examination.

I came in this morning and found both players are still running without any apparent problem.

It would seem that the memory leak was due to the IE rendering built into .NET. I will make the registry change on the first computer this morning, then put the external content layout on it and let it run to see how it interacts over time. My guess is that it will be fine, and that your team has seen nothing wrong with the layout on your test machine.

All that being said, please allow me to apologize if it turns out my lack of knowledge regarding Windows registry has caused undue work on the part of you and the rest of your team. I truly appreciate your time and effort.

Again, I will report in when I have more information.

Chris

Ok, my initial report turned out to be a little bit more positive than it should have been. After sending that last reply, I found that the second computer, on which I had tried the registry fix and on which the player appeared to have successfully run all night, was in fact stalled out since approximately 2 hours after I enabled it yesterday. I hadn’t noticed the time on it, nor the difference in the external content displayed until it was too late.

I took care of the registry entry on the first computer, started both of the players, then left the office for several hours, and came back to find that both players appear to have simply stalled - also approximately 2 hours after enabling them. There is a pop-up on both that says “Xibo Open Source Digital Signage is not responding”. In both cases, there is an option to “Close the program”, or to “Wait for the program to respond”. Clicking the latter does nothing but cause the stalled player to grey out; nothing further happened on either. Clicking on the former does exactly what it says.

In both cases, the Event Viewer shows the following data:

First computer:

Log Name:      Application
Source:        Application Hang
Date:          6/1/2016 2:30:09 PM
Event ID:      1002
Task Category: (101)
Level:         Error
Keywords:      Classic
User:          N/A
Computer:      Xibo1
Description:
The program XiboClient.exe version 2.0.0.0 stopped interacting with Windows and was closed. To see if more information about the problem is available, check the problem history in the Action Center control panel.
 Process ID: a6c
 Start Time: 01d1bbfba487afa4
 Termination Time: 51
 Application Path: C:\Program Files (x86)\Xibo Player\XiboClient.exe
 Report Id: 7d55cfa0-2822-11e6-ad4b-d02788d19ba7

Event Xml:
<Event xmlns="http://schemas.microsoft.com/win/2004/08/events/event">
  <System>
    <Provider Name="Application Hang" />
    <EventID Qualifiers="0">1002</EventID>
    <Level>2</Level>
    <Task>101</Task>
    <Keywords>0x80000000000000</Keywords>
    <TimeCreated SystemTime="2016-06-01T18:30:09.000000000Z" />
    <EventRecordID>2858</EventRecordID>
    <Channel>Application</Channel>
    <Computer>Xibo1</Computer>
    <Security />
  </System>
  <EventData>
    <Data>XiboClient.exe</Data>
    <Data>2.0.0.0</Data>
    <Data>a6c</Data>
    <Data>01d1bbfba487afa4</Data>
    <Data>51</Data>
    <Data>C:\Program Files (x86)\Xibo Player\XiboClient.exe</Data>
    <Data>7d55cfa0-2822-11e6-ad4b-d02788d19ba7</Data>
    <Binary>55006E006B006E006F0077006E0000000000</Binary>
  </EventData>
</Event>

Second computer:

Log Name:      Application
Source:        Application Hang
Date:          6/1/2016 2:28:21 PM
Event ID:      1002
Task Category: (101)
Level:         Error
Keywords:      Classic
User:          N/A
Computer:      user-PC
Description:
The program XiboClient.exe version 2.0.0.0 stopped interacting with Windows and was closed. To see if more information about the problem is available, check the problem history in the Action Center control panel.
 Process ID: 8bc
 Start Time: 01d1bbfd25808255
 Termination Time: 296
 Application Path: C:\Program Files (x86)\Xibo Player\XiboClient.exe
 Report Id: 7ec9c93a-2822-11e6-b8c5-64006a823d2d

Event Xml:
<Event xmlns="http://schemas.microsoft.com/win/2004/08/events/event">
  <System>
    <Provider Name="Application Hang" />
    <EventID Qualifiers="0">1002</EventID>
    <Level>2</Level>
    <Task>101</Task>
    <Keywords>0x80000000000000</Keywords>
    <TimeCreated SystemTime="2016-06-01T18:28:21.000000000Z" />
    <EventRecordID>2565</EventRecordID>
    <Channel>Application</Channel>
    <Computer>user-PC</Computer>
    <Security />
  </System>
  <EventData>
    <Data>XiboClient.exe</Data>
    <Data>2.0.0.0</Data>
    <Data>8bc</Data>
    <Data>01d1bbfd25808255</Data>
    <Data>296</Data>
    <Data>C:\Program Files (x86)\Xibo Player\XiboClient.exe</Data>
    <Data>7ec9c93a-2822-11e6-b8c5-64006a823d2d</Data>
    <Binary>55006E006B006E006F0077006E0000000000</Binary>
  </EventData>
</Event>

I did not see a large amount of memory being utilized this time, on either computer, so perhaps the memory leak has been fixed, but now I feel like I’m back to the drawing board; while this didn’t crash, it also did not continue to run as I had hoped it would.

Next? I am going to put the pre-release version on the second computer and test it alongside 1.7.7 on the first computer. As before, I will report back as I have more data.

Thank you for continuing to look into this with me.

Chris

Perhaps - but at the same time it does appear to have improved the memory usage problem you were having? Granted it seems to have exposed another problem.

Are both the tests you have conducted thus far using the 1.7.8 pre-release version? or the standard 1.7.7 player (I am hoping you will say standard)

They are both running standard 1.7.7, still. I am planning to install 1.7.8 on the second computer shortly and get started with it.

I ran out of memory again at some point between starting the player (on the first computer, the one which I documented two days ago) at 4:00 pm EDT yesterday and 7:30 am EDT when I came in this morning. Here is today’s roundup of information:

There were 17 of these on the screen:

As you can see, the vast majority of the memory usage belongs to Xibo:

There are two entries in the Event Viewer. The first is an Information event:

Log Name:      Application
Source:        Windows Error Reporting
Date:          6/2/2016 7:26:57 AM
Event ID:      1001
Task Category: None
Level:         Information
Keywords:      Classic
User:          N/A
Computer:      Xibo1
Description:
Fault bucket , type 0
Event Name: AppHangB1
Response: Not available
Cab Id: 0

Problem signature:
P1: XiboClient.exe
P2: 2.0.0.0
P3: 570cdd87
P4: fcf6
P5: 0
P6: 
P7: 
P8: 
P9: 
P10: 

Attached files:
C:\Users\xibo1\AppData\Local\Temp\WERD468.tmp.appcompat.txt
C:\Users\xibo1\AppData\Local\Temp\WERD4F6.tmp.WERInternalMetadata.xml

These files may be available here:
C:\Users\xibo1\AppData\Local\Microsoft\Windows\WER\ReportArchive\AppHang_XiboClient.exe_14f511f6a32cb39e1fde26bbaea2b3f95cc79cf_0ae5d820

Analysis symbol: 
Rechecking for solution: 0
Report Id: 77a694fa-28b4-11e6-ad4b-d02788d19ba7
Report Status: 1
Event Xml:
<Event xmlns="http://schemas.microsoft.com/win/2004/08/events/event">
  <System>
    <Provider Name="Windows Error Reporting" />
    <EventID Qualifiers="0">1001</EventID>
    <Level>4</Level>
    <Task>0</Task>
    <Keywords>0x80000000000000</Keywords>
    <TimeCreated SystemTime="2016-06-02T11:26:57.000000000Z" />
    <EventRecordID>2865</EventRecordID>
    <Channel>Application</Channel>
    <Computer>Xibo1</Computer>
    <Security />
  </System>
  <EventData>
    <Data>
    </Data>
    <Data>0</Data>
    <Data>AppHangB1</Data>
    <Data>Not available</Data>
    <Data>0</Data>
    <Data>XiboClient.exe</Data>
    <Data>2.0.0.0</Data>
    <Data>570cdd87</Data>
    <Data>fcf6</Data>
    <Data>0</Data>
    <Data>
    </Data>
    <Data>
    </Data>
    <Data>
    </Data>
    <Data>
    </Data>
    <Data>
    </Data>
    <Data>
C:\Users\xibo1\AppData\Local\Temp\WERD468.tmp.appcompat.txt
C:\Users\xibo1\AppData\Local\Temp\WERD4F6.tmp.WERInternalMetadata.xml</Data>
    <Data>C:\Users\xibo1\AppData\Local\Microsoft\Windows\WER\ReportArchive\AppHang_XiboClient.exe_14f511f6a32cb39e1fde26bbaea2b3f95cc79cf_0ae5d820</Data>
    <Data>
    </Data>
    <Data>0</Data>
    <Data>77a694fa-28b4-11e6-ad4b-d02788d19ba7</Data>
    <Data>1</Data>
  </EventData>
</Event>

The second is the Error event:

Log Name:      Application
Source:        Application Hang
Date:          6/2/2016 7:26:57 AM
Event ID:      1002
Task Category: (101)
Level:         Error
Keywords:      Classic
User:          N/A
Computer:      Xibo1
Description:
The program XiboClient.exe version 2.0.0.0 stopped interacting with Windows and was closed. To see if more information about the problem is available, check the problem history in the Action Center control panel.
 Process ID: f40
 Start Time: 01d1bc37dc1d1d14
 Termination Time: 15
 Application Path: C:\Program Files (x86)\Xibo Player\XiboClient.exe
 Report Id: 77a694fa-28b4-11e6-ad4b-d02788d19ba7

Event Xml:
<Event xmlns="http://schemas.microsoft.com/win/2004/08/events/event">
  <System>
    <Provider Name="Application Hang" />
    <EventID Qualifiers="0">1002</EventID>
    <Level>2</Level>
    <Task>101</Task>
    <Keywords>0x80000000000000</Keywords>
    <TimeCreated SystemTime="2016-06-02T11:26:57.000000000Z" />
    <EventRecordID>2866</EventRecordID>
    <Channel>Application</Channel>
    <Computer>Xibo1</Computer>
    <Security />
  </System>
  <EventData>
    <Data>XiboClient.exe</Data>
    <Data>2.0.0.0</Data>
    <Data>f40</Data>
    <Data>01d1bc37dc1d1d14</Data>
    <Data>15</Data>
    <Data>C:\Program Files (x86)\Xibo Player\XiboClient.exe</Data>
    <Data>77a694fa-28b4-11e6-ad4b-d02788d19ba7</Data>
    <Binary>55006E006B006E006F0077006E0000000000</Binary>
  </EventData>
</Event>

I did a lot of digging in an effort to determine how to correctly add the IE 11 fix to the registry, but I have to admit that I am not sure I have done it correctly. As a sanity check, this is what I added, to both the 64 and 32 bit folders as indicate in the post from Alex, which I quoted earlier:

If that’s wrong, I would appreciate (after you get done laughing at me, which I would fully expect!) a small tutorial on how to correctly add that.

On to installing 1.7.8…

2 things that spring to mind…

  1. if we are back to memory problems, then the “simple layout” test is still valid I think - i.e. does a simple layout run out of memory or not, regardless of the IE setting.

  2. Your IE setting is incorrect unfortunately - it is nearly there, but the “value” (the XiboClient.exe bit) needs to be under the “FEATURE_BROWSER_EMULATION” key, not the “IE 11 emulation” key you have created, which can be removed.

Basically so it looks like this:

Ok, I did the registry entry incorrectly. I had the feeling that would be the case. That’s fixed on both computers, now.

I have the simple layout running on the first computer, now, so we can compare to see if it runs out of memory or not. I will let that run for now, and continue with the plan for 1.7.8 on the second computer.

I needed to leave the office for a time today, so I enabled my external content layout on the second computer while I was out. I took a screen shot before I left at 11:36, when it was at 576 MB:

I took another screen shot when I got back at 12:30, and the memory usage was up to 1.2 GB:

I turned it off at that point, and proceeded to uninstall 1.7.7 and installed 1.7.8. I then enabled the external content layout on the new player, and found that in less than an hour, it was at 1.5 GB memory:

It has not crashed, yet, that I am aware, but it is definitely using a lot of memory, and the number seems to be slowly growing.

Edit: The time on that last screenshot was 13:24. At 13:54, I was looking at things, and noticed that the display still read 13:24. I clicked on the display and was met with the pop-up again:

I clicked to close the player, it closed correctly, and the watchdog restarted the player shortly after. I know there was no watchdog on 1.7.7, so I know I got this right, but it still died. The difference is that I didn’t see the pop-up until I clicked on the stalled player. The only way I knew the player was stalled was by the time not being current, as I wasn’t paying attention to the fact that the photos in the top left weren’t rotating as they should have been.

The simple layout on 1.7.7 on the first computer is still running without any apparent problems, though it has only been a few short hours. I will continue to monitor both of them to see how they are working, and will report back as I find further information.

I just looked over at the second computer (running 1.7.8) and found that it is stacking OOM pop-ups all over the place:

I absolutely fixed the registry issue (both keys, as indicated earlier):

In the mean time, the simple layout is happily chugging away trading two pictures out on a 60 second rotation without any problem, so it would appear that the problem lies in the external content, as expected.

If there is anything I can do to collect further information, please let me know. I am continuing to explore options in an effort to finally resolve this, but your team knows far more about this than I do.

That is interesting - in 1.7.8 we have tried to prevent windows from opening any error reporting dialogs so that if the application wants to close - it just closes. That doesn’t appear to be happening for you, which is odd.

What I had hoped would happen on your second PC is that you would see the memory rising (as you do), it would reach a size whereby it ran out of memory and would terminate. It would then restart.

I appreciate that doesn’t resolve the root cause - but that is what I hoped would happen as a workaround.


Once you are confident that the simple layout is not leaking memory, can you add a text item to it and repeat your test? Text items will use a web browser to render the content and that may be enough to trigger the leak.

If it isn’t - then we should add the items you have on your complex layout - one by one - until we see a problem.

Good morning.

1.7.8 ran out of memory again last night after about 6 hours. Once again, the little OOM pop-up was the problem; once I closed the two that were on the screen, watchdog started the program back up almost instantly. Note that, as with the last time, the OOM pop-up says “Message from webpage”. I have it running again, and will continue to monitor it. I am curious to find out if watchdog kept things going through multiple crashes for that 6 hours, or if it took that long to finally crash, as this is the longest stretch I have had the player running with the external content.

Regarding the simple layout, it has been running for nearly 24 hours now with no issues. I am going to add some text to it shortly, by way of the clock that displays in my external content layout so I can keep an eye on time if it crashes again, as Windows only logs the time when I acknowledge the problem rather than the time the problem occurred. I will also be working on setting up an older computer today, on which I will be attempting to utilize an older version of Xibo, as my boss has told me that he had a webpage running on 1.5 two or three years ago or so with no problems at all. I question that a little, but he’s getting anxious to get this project running, so I’m going to try it on my test server with a third computer. I love having this server available for my exclusive use!

More as I get it.

Thought/question:

Is it possible that Xibo player is caching web content and not clearing it until memory is used up? I don’t know how that works, but it seems plausible, at least.

My simple layout is running with the clock on a 60 second rotation like the images:

Friday
June 03, 2016 08:40

For anyone who is trying to format time, I used the following to display the day, date and time:

[dddd]
[MMMM dd, yyyy HH:mm]

Again, more as I get it.

That is entirely possible - its the same old case of the more features you have the more chance there is for something to go wrong. The difficultly here is locating the problem - is it IE, is it .NET, is it Xibo, is it the webpage itself, etc.

I think that is coming from Internet Explorer rather than from Xibo, which is probably why I have no control over it - or rather whether it comes up or not.


I am pretty sure there is something on one of the pages you are loading that is leaking memory and that once we isolate it, we will be good.

Yes, quite possible and much explored by others using the web browser control in other software. In Xibo each time the media/region is expired the web browser is completely torn down and cleared out.