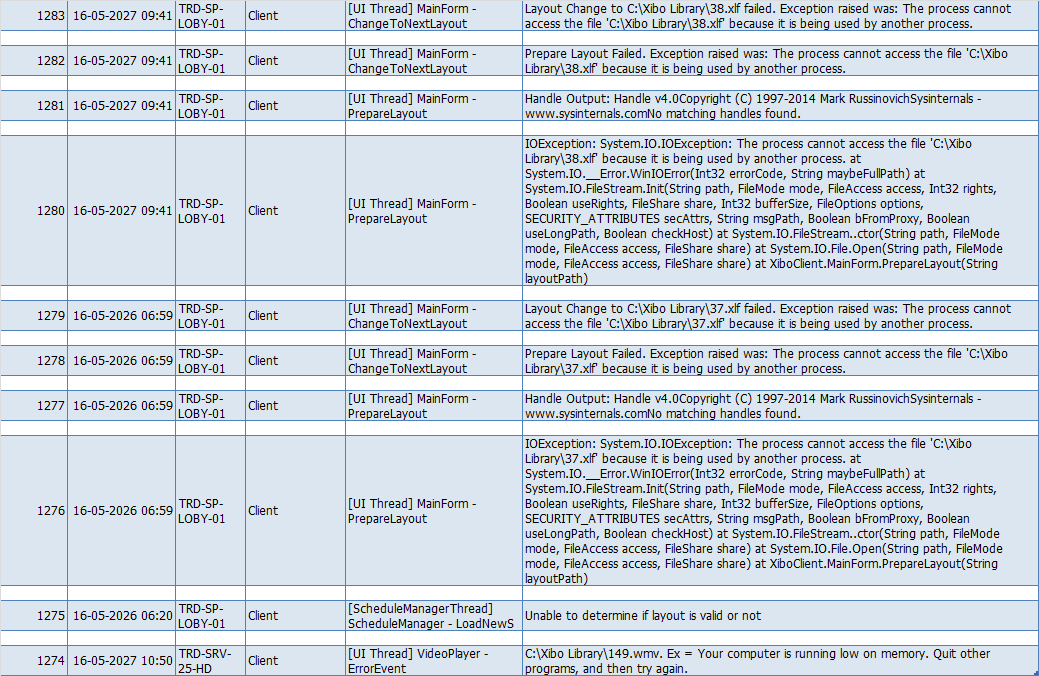
Yes, the client reports the error at the same moment sharing violation occurs, and no the error would actually NOT repeat in the client logs, it would show up once, and really only by looking at the display can you tell that something is wrong.
To summarize: the offending layout is indeed always the NEXT one in sequence and not the one on which the display stops, if there is a region on the current layout it will time out and disapear, leaving only the background image, if it is an image only layout, it will just show that indefinitely (until something is added to the schedule, priority slide comes up, or the client is restarted).
Not sure if it helps (or if it is indeed the universal case) but if you look at the PML log carefully, we noticed that the process sequence for the layouts is always create file/close file, with read and network query and other processes, thrown in there at the appropriate times, except at the instance sharing violation occurs.
So maybe the error itself is not the sharing violation but rather the lack of “close file” for XLF at that time (150 in this case). You can see the processes starting at 7:45:21 (or rather 6 by your time-zone) for XLF 150, the sequence is: create, query network…, close, create, query network…, close, CREATE, query standard…, read, CREATE; and that’s when the sharing violation occurs.
I cannot locate another place in the log where the same xlf is being created twice, without being closed in the meantime. As I said, not sure if it helps, just noticing 

