# Building an 'Hours since last incident' counter with DataSets 1.8
**URL:** https://community.xibo.org.uk/t/building-an-hours-since-last-incident-counter-with-datasets-1-8/18040
**Category:** Guides
**Created:** [March 18, 2019, 2:33pm UTC](https://community.xibo.org.uk/t/building-an-hours-since-last-incident-counter-with-datasets-1-8/18040 "2019-03-18T14:33:16Z")
**Posts on this page:** 2
**Page:** 1
### Author:  [@natasha](https://community.xibo.org.uk/u/natasha)
#### Post date: [March 18, 2019, 2:33pm UTC](https://community.xibo.org.uk/t/building-an-hours-since-last-incident-counter-with-datasets-1-8/18040/1 "2019-03-18T14:33:16Z")
**Using DataSets to display “Hours since last incident” counter with Xibo**
**Please note:** If you are using v2, please use the following link: [Building an ‘Hours since last incident’ counter with DataSets](https://community.xibo.org.uk/t/building-an-hours-since-last-incident-counter-with-datasets/14391).
**1. Introduction**
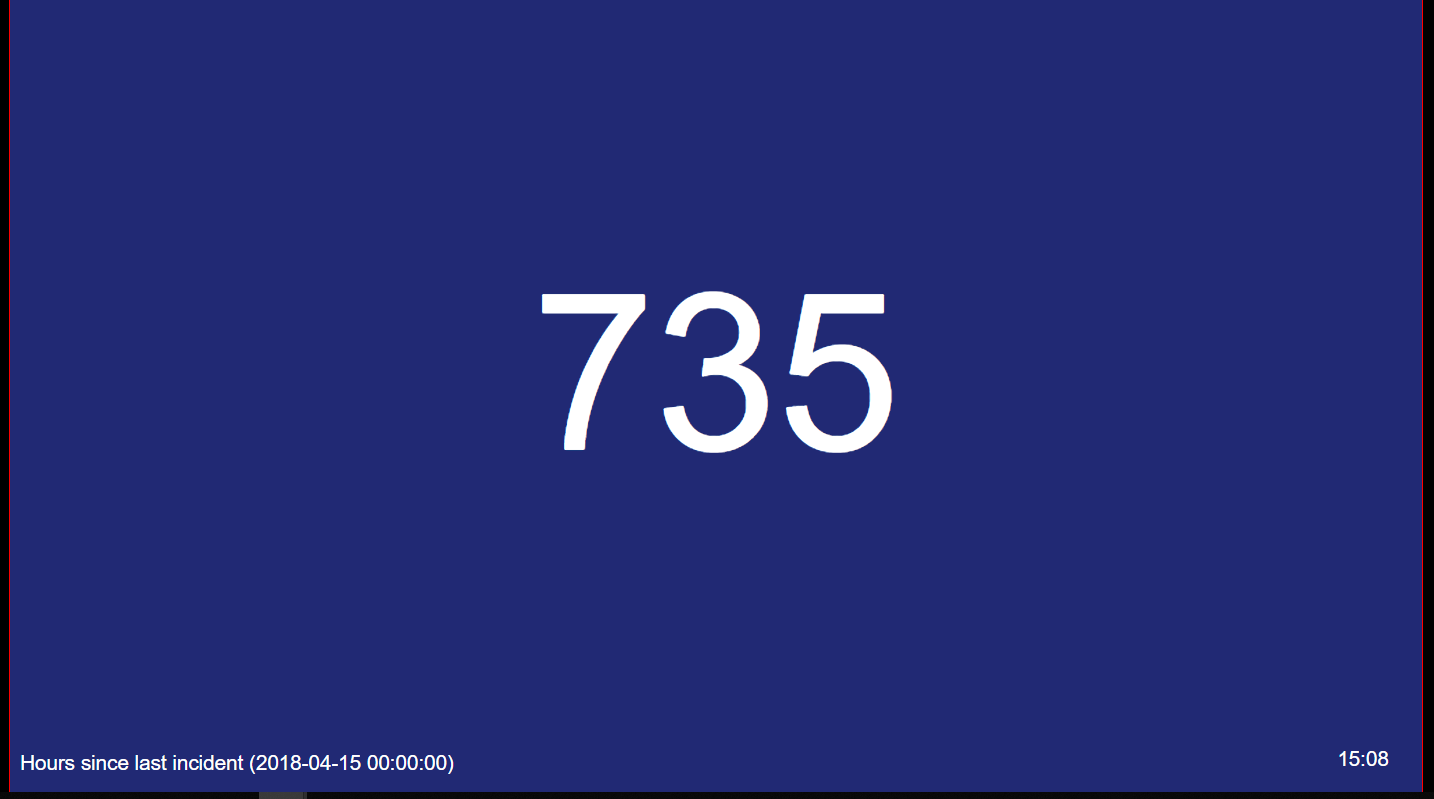
This tutorial will walk you through the process of how you can produce a Layout to show the hours since there was an error in a process, that will automatically update from the information held in a created DataSet.
If you are not yet familiar with DataSets then you may want to read our [Getting Started Guide - DataSets](https://community.xibo.org.uk/t/getting-started-guide-datasets/14149) before attempting this tutorial.
**2. Before you begin**
To ensure that all the features used in this tutorial are available you will need to be using Xibo CMS 1.8.0 or later. Earlier versions do have DataSets available but do not have the features used in this walkthrough
**3. Creating DataSets**
1. Log in to your CMS and go to Library \> DataSets
2. Click on the Add DataSet button and name it ‘Last Incident’ and Save.
We now need to define the fields that the DataSet will hold and include a DataSet formula to work out the hours since.
We need to create 2 columns in the DataSet:
- dtLastIncident
- hSinceLast
Click on the drop-down menu for your DataSet ‘Last Incident’ and View Columns. One Column (Col1) has been added by default.
Click on the drop-down button next to Col1 to Edit.
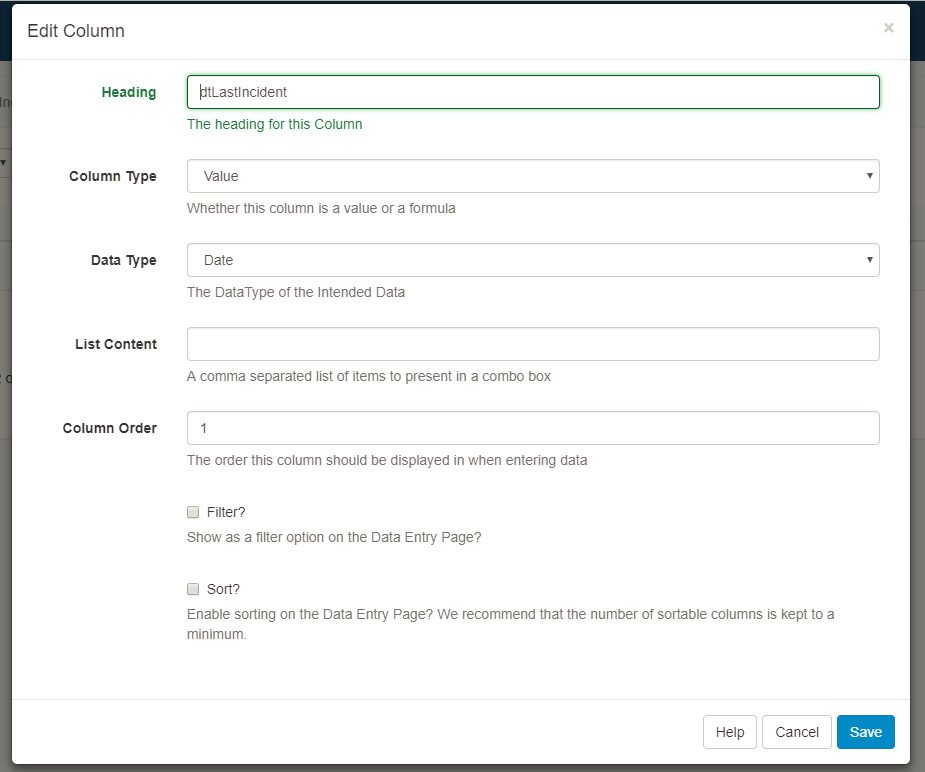
1. Change Heading to ‘dtLastIncident’
2. Column Type set to ‘Value’
3. Data Type set to ‘Date’
4. Column Order set to ‘1’ (the other values can be left blank)
5. Save
Add another Column:
1. Heading ‘hSinceLast’
2. Column Type set to ‘Formula’
3. Data Type set to ‘Number’
4. Column Order set to ‘2’
5. Formula copy and paste the following: `time_format(timediff(NOW(),dtLastIncident),'%H')`
6. Save
You should now have a Column structure that looks like this:
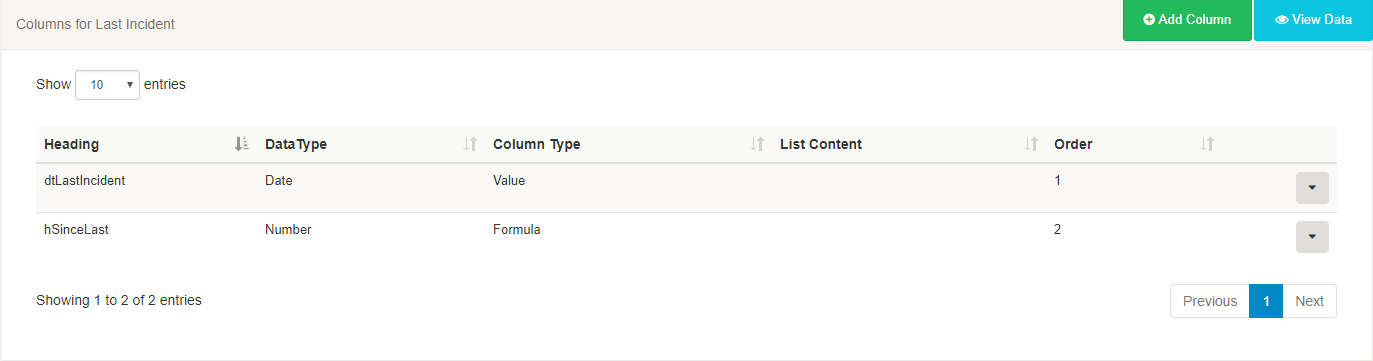
Now we need to add data to our DataSet. Click on the View Data button, then Add Row.
Using the date-picker enter a date and time (in this example I have selected a date from the previous month to demonstrate the formula calculation), Save.
You should now have a structured DataSet containing information that we can use in Layouts!
**4. Creating a Layout to leverage your DataSet**
From the main Dashboard, go to Layouts
1. Add Layout - Name it Last Incident
2. Resize and position the Region using the drop-down and selecting Options:
Top - 338
Left - 0
Width - 1920
Height - 405, Save
3. Save Regin Positions
4. Add an image or choose a coloured background
5. Edit the Region Timeline
6. Select Ticker
7. Source Type, drop down and select DataSet
8. Dataset, drop down and select Last Incident
9. Save
You can now Edit the Ticker to suit your specific needs using the different tabs:
**_General_**
1. Tick ‘Set a duration’ to change the default time (I have chosen a duration of 300 seconds).
2. Select No effect - all items are shown
3. Speed is set to 2 (as no effects have been selected).
4. Apply
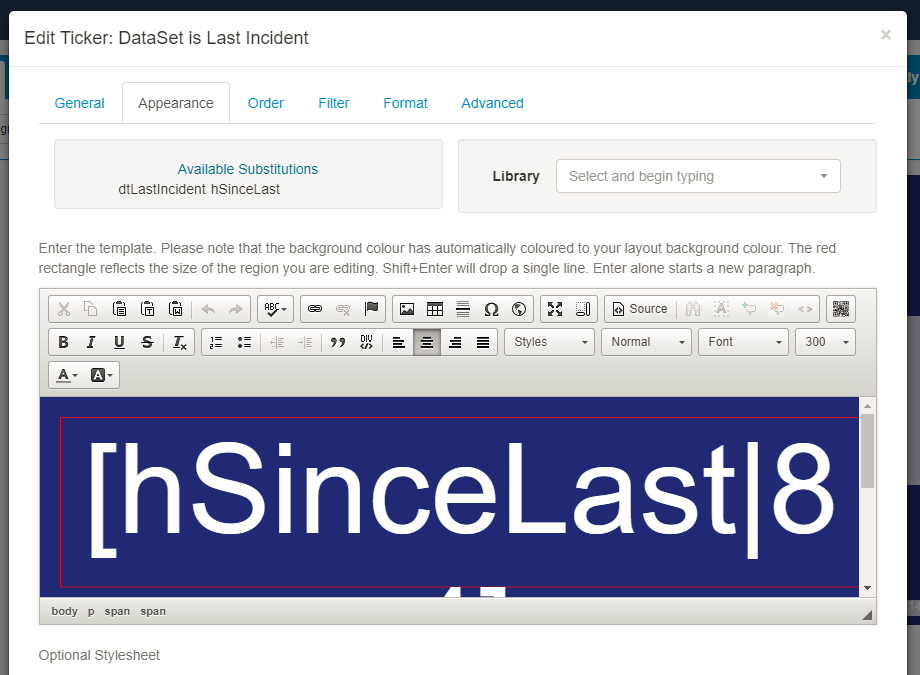
**_Appearance_**
1. Double click on hSinceLast text field, under Available Substitutions, to add to your Layout.
2. Using the text editor edit the text to make it look more attractive in your Layout. (I have resized to 300, centered and coloured white).
3. Apply
**_Advanced tab_**
1. Enter a message, using the text editor, to display a message when there is no data returned from the source.
2. Save
3. Close your Region Timeline.
You will now see that your Region is displaying the ‘hours since last incident”.
So that the Layout has more context to the audience, I have included a Region to display the date and time of the last incident, which will use the same DataSet information and a Region with a clock Widget to display the current time.
_First additional Region:_
1. Add a Region
2. Resize and position using the drop-down and select Options:
Top - 1026
Left - 14
Width - 686
Height - 50, Save
3. Save Regin Positions
4. Edit the Region Timeline
5. Select Ticker
6. Source Type, drop down and select DataSet
7. Dataset, drop down and select Last Incident
8. Save
Edit Ticker
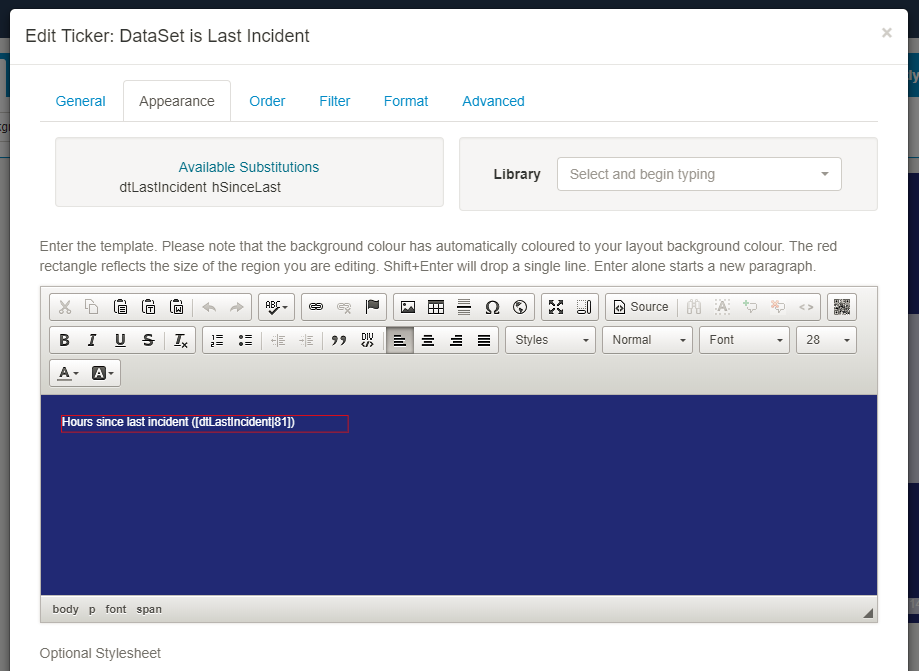
_ **Appearance** _
Using the text editor write ‘Hours since last incident’, size 28, white , left aligned.
Select dtLastIncident from the Available Substitutions.
**_Advanced_**
Include a message to display when no data is returned from the source.
_Second additional Region:_
1. Add a Region
2. Resize and position using the drop-down and select Options:
Top - 1020
Left - 1685
Width - 190
Height - 38
3. Save Regin Positions
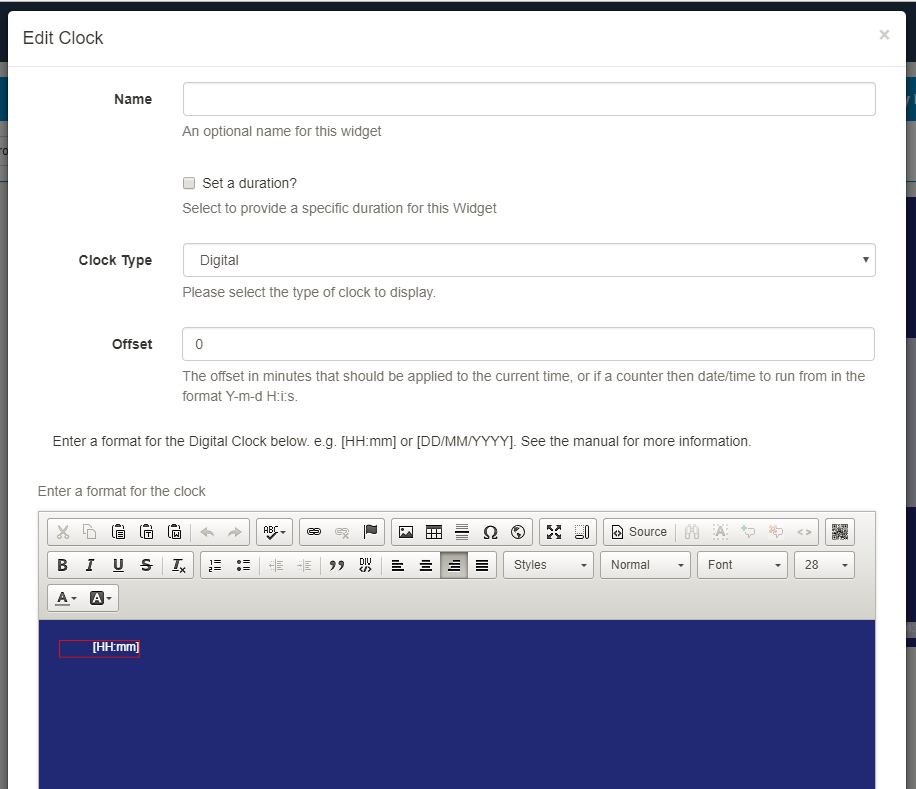
4. Edit the Region Timeline
5. Add Clock Widget
6. Clock Type - Digital
7. Format style - [HH:mm], size 28, white, right aligned
8. Save
Preview your Layout using the Actions tab to see the correct information displayed as defined in the DataSet.
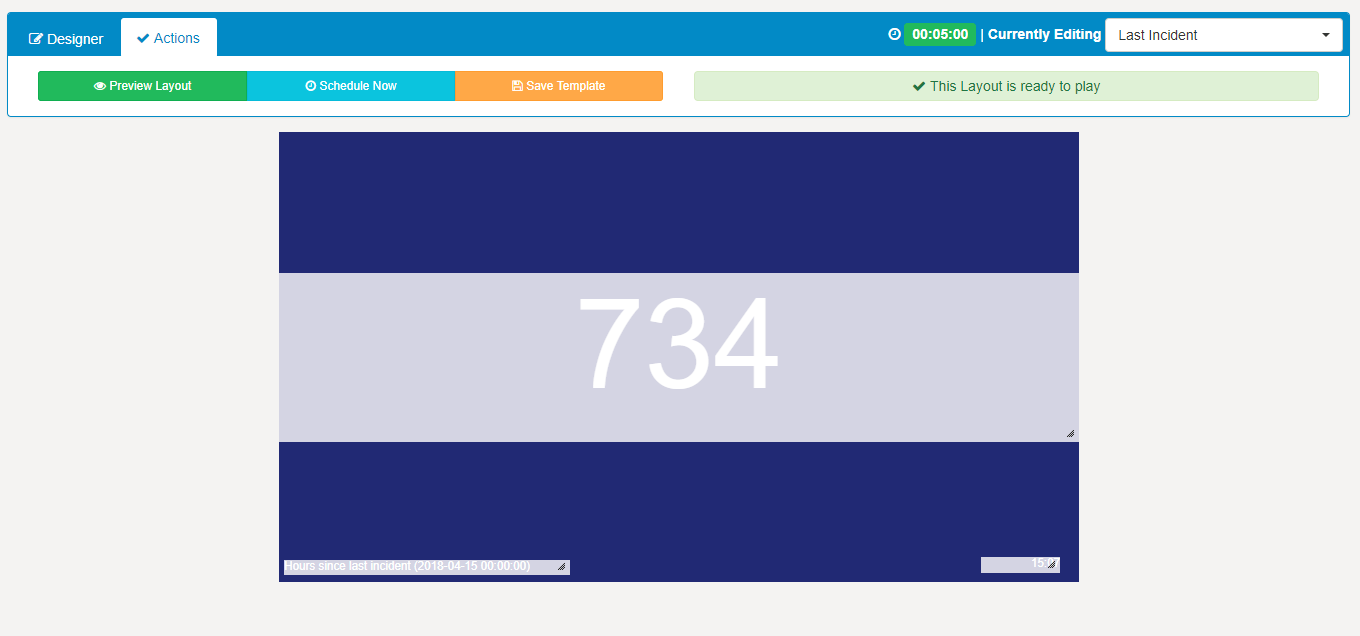
You can now schedule your Layout to your chosen displays or display groups.
When there is an incident just simply update the Last Incident DataSet :
1. Library - DataSet
2. Last Incident - View Data
3. Click on the date and time fields and update
4. Save
Changes to the DataSet will be available in the system straight away ready to be picked up by clients on their next collection.
This is just one example of the many ways you can utilise DataSets with Xibo!
Additional help available:
[Troubleshooting](https://xibo.org.uk/manual/en/troubleshooting.html)
---
### Author:  [@natasha](https://community.xibo.org.uk/u/natasha)
#### Post date: [March 18, 2019, 6:31pm UTC](https://community.xibo.org.uk/t/building-an-hours-since-last-incident-counter-with-datasets-1-8/18040/2 "2019-03-18T18:31:05Z")